A
B
C
D
Text Solution
Verified by Experts
The correct Answer is:


Topper's Solved these Questions
Similar Questions
Explore conceptually related problems
NCERT FINGERTIPS-BIOMOLECULES-Biomolecules
- Read the given statements and select the correct option. Statement 1...
Text Solution
|
- Biochemical reagents are widely used for detection of biomolecules. A ...
Text Solution
|
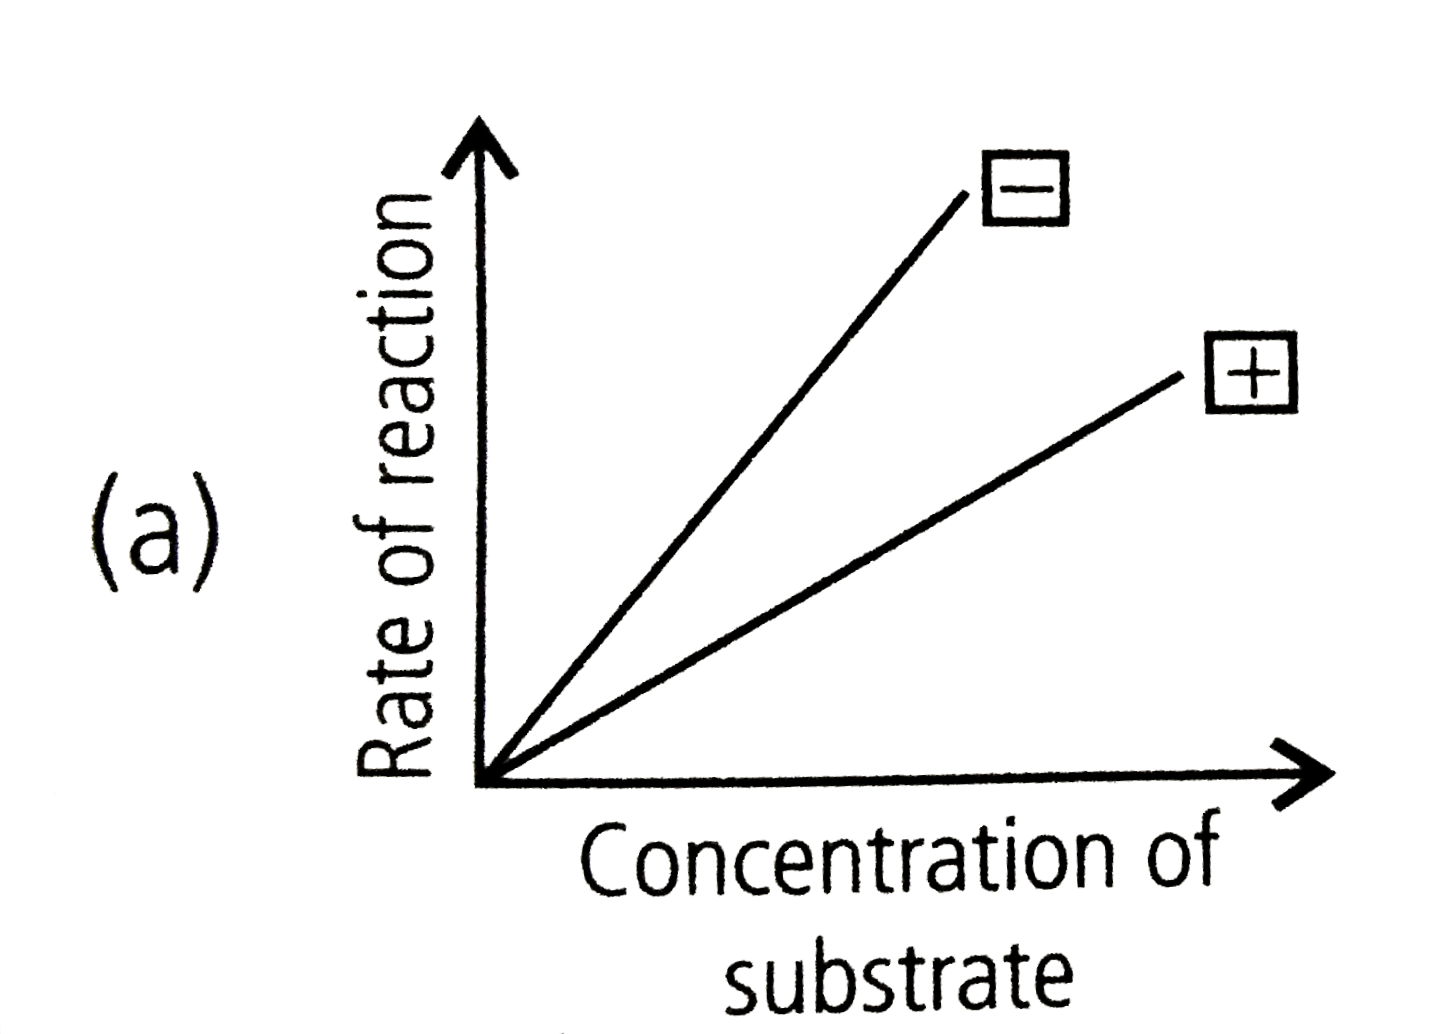
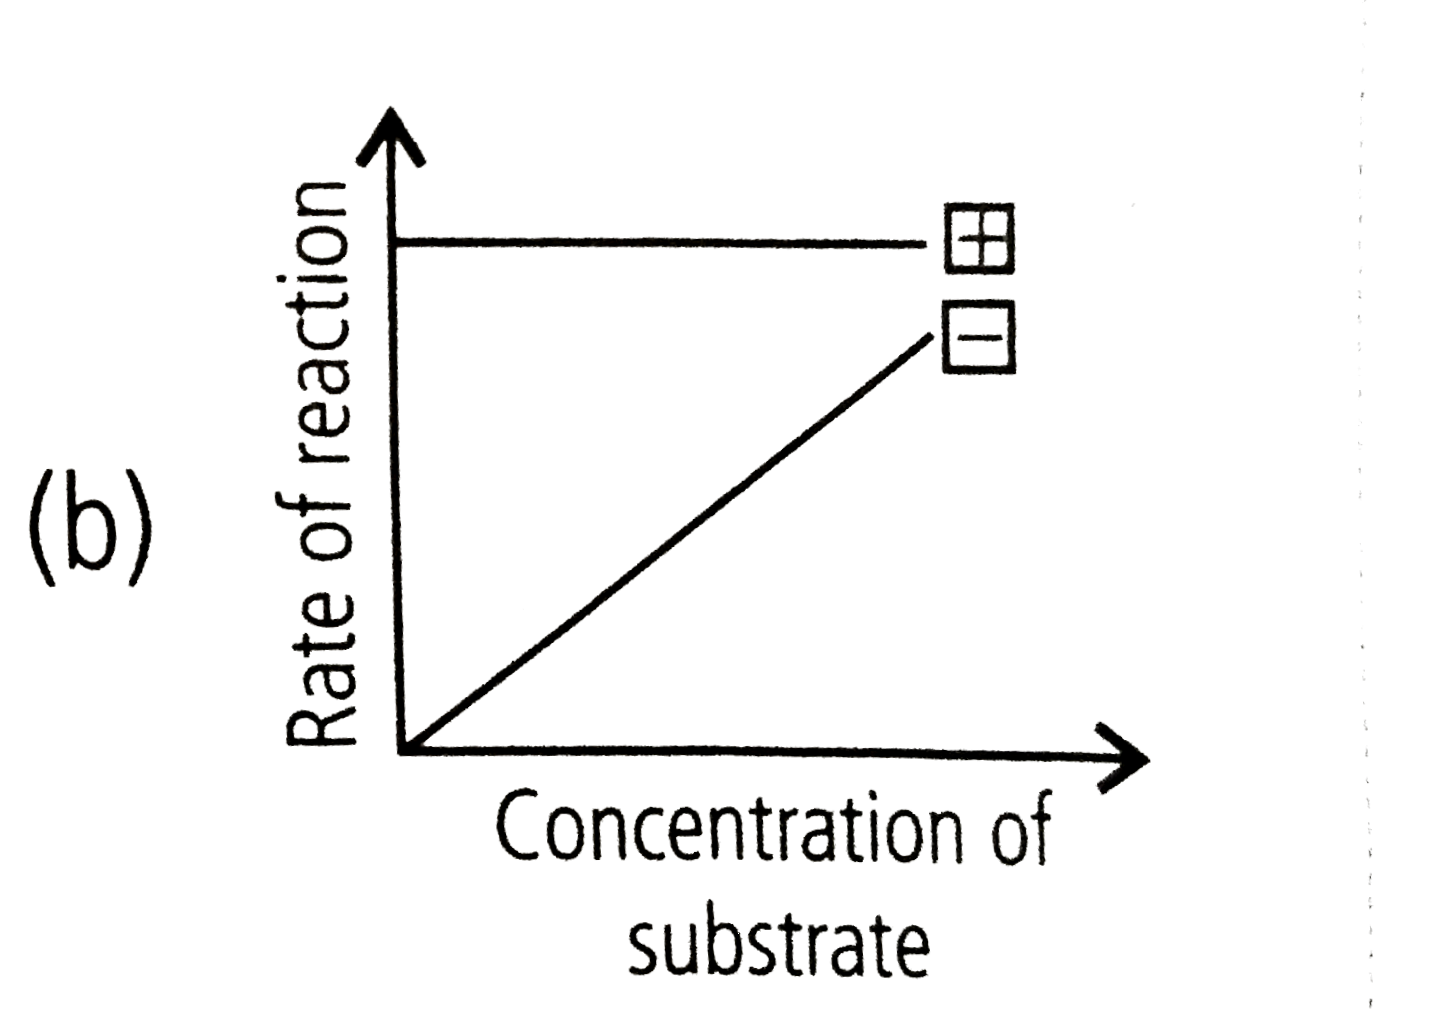
- Which of the following graphs correctly indicates the reaction in pres...
Text Solution
|
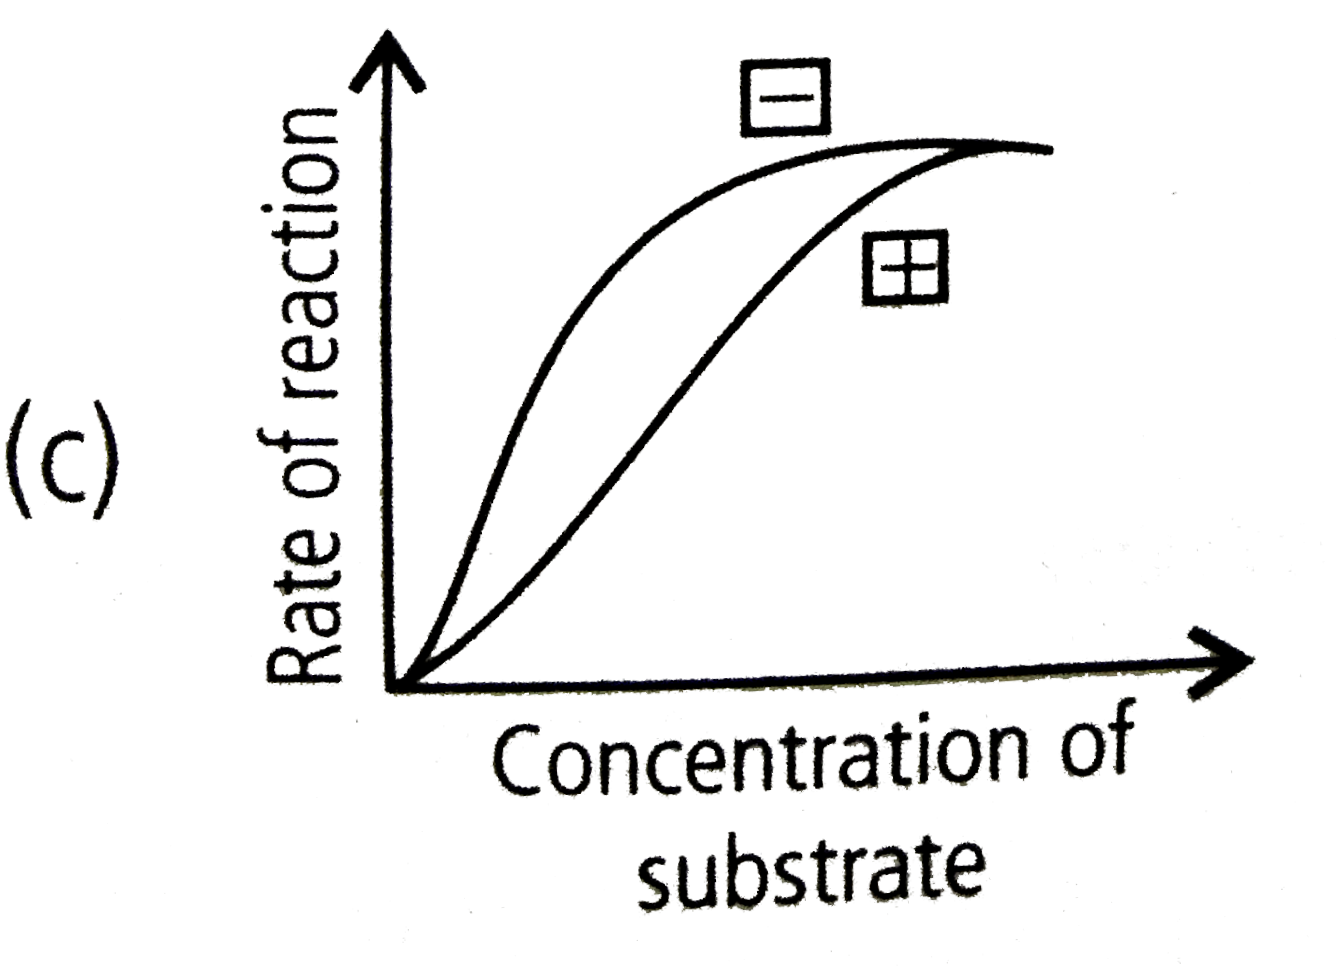
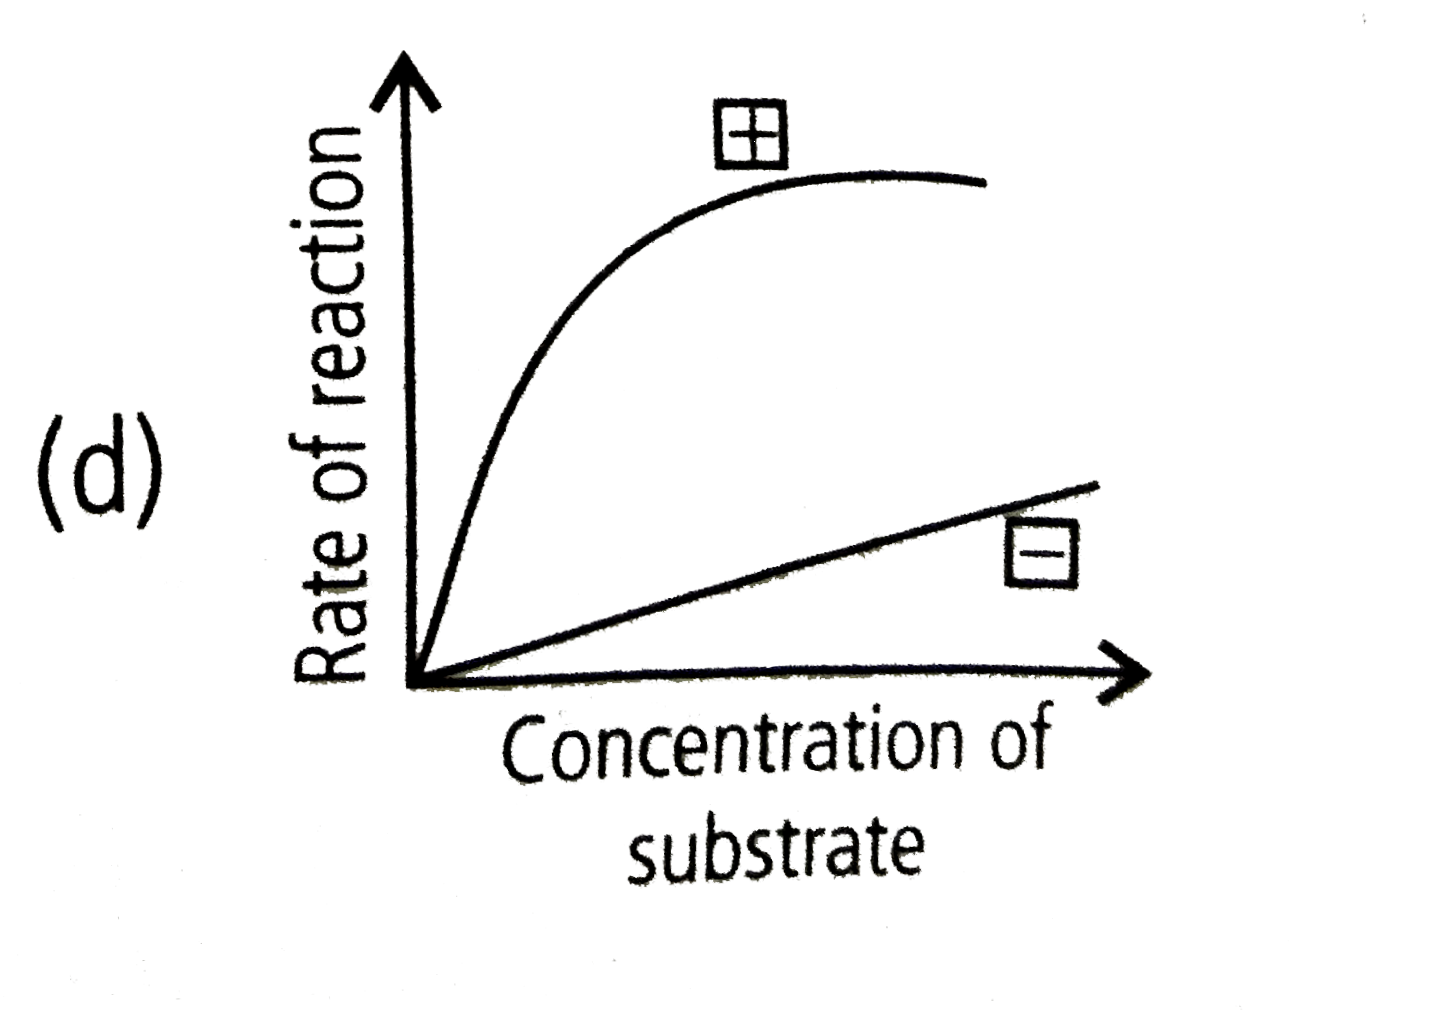
- Which of the following graphs correctly indicates the reaction in pres...
Text Solution
|
- Refer to the given graph showing relationship between temperature and ...
Text Solution
|
- Refer to the given graph showing state of ionisation of zwitterion. ...
Text Solution
|
- Study the given data and answer the questions that follow. A sample ...
Text Solution
|
- Study the given data and answer the questions that follow. A sample ...
Text Solution
|
- Study the given data and answer the questions that follow. A sample ...
Text Solution
|
- It is said that elemental composition of living organisms and that of ...
Text Solution
|
- Many elements are found in living organisms either free or in the form...
Text Solution
|
- Amino acids have both an amino group and a carboxy group in their stru...
Text Solution
|
- An amino acid under certain conditions have both positive and negative...
Text Solution
|
- Which of the following sugars have the same number of carbon as presen...
Text Solution
|
- An acid soluble compound formed by phyosphorylation of nucleoside is c...
Text Solution
|
- When we homogenise any tissue in an acid the acid soluble pool represe...
Text Solution
|
- The most abundant chemical in living organisms could be
Text Solution
|
- A homopolymer has only one type of building block called monomer repea...
Text Solution
|
- Proteins perform many physological functions. For example, some protei...
Text Solution
|
- Glycogen is a homonpolymer made up of
Text Solution
|