


Similar Questions
Explore conceptually related problems
Recommended Questions
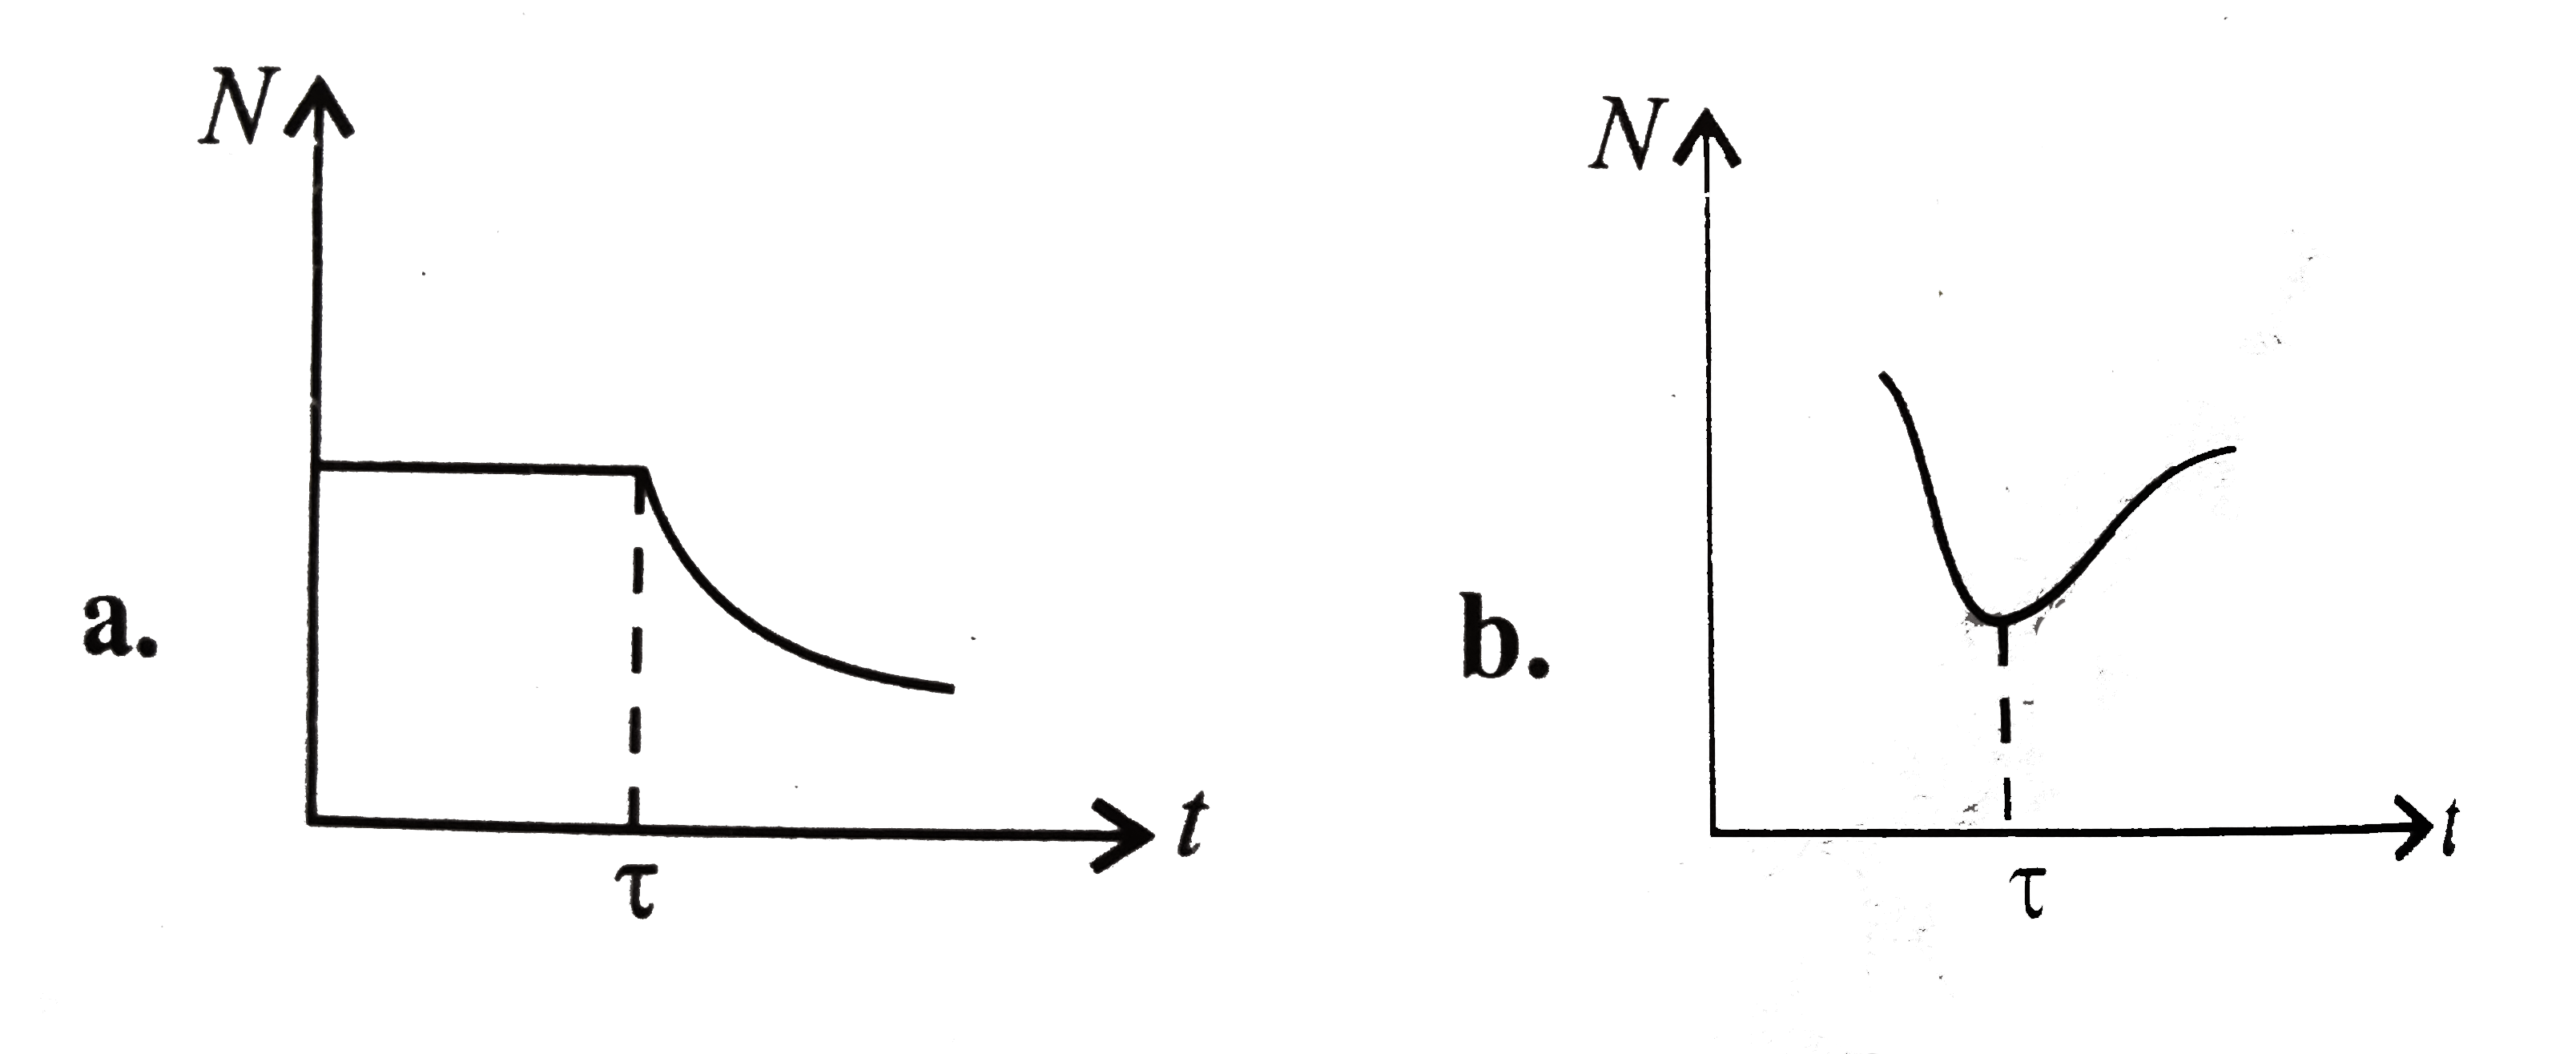
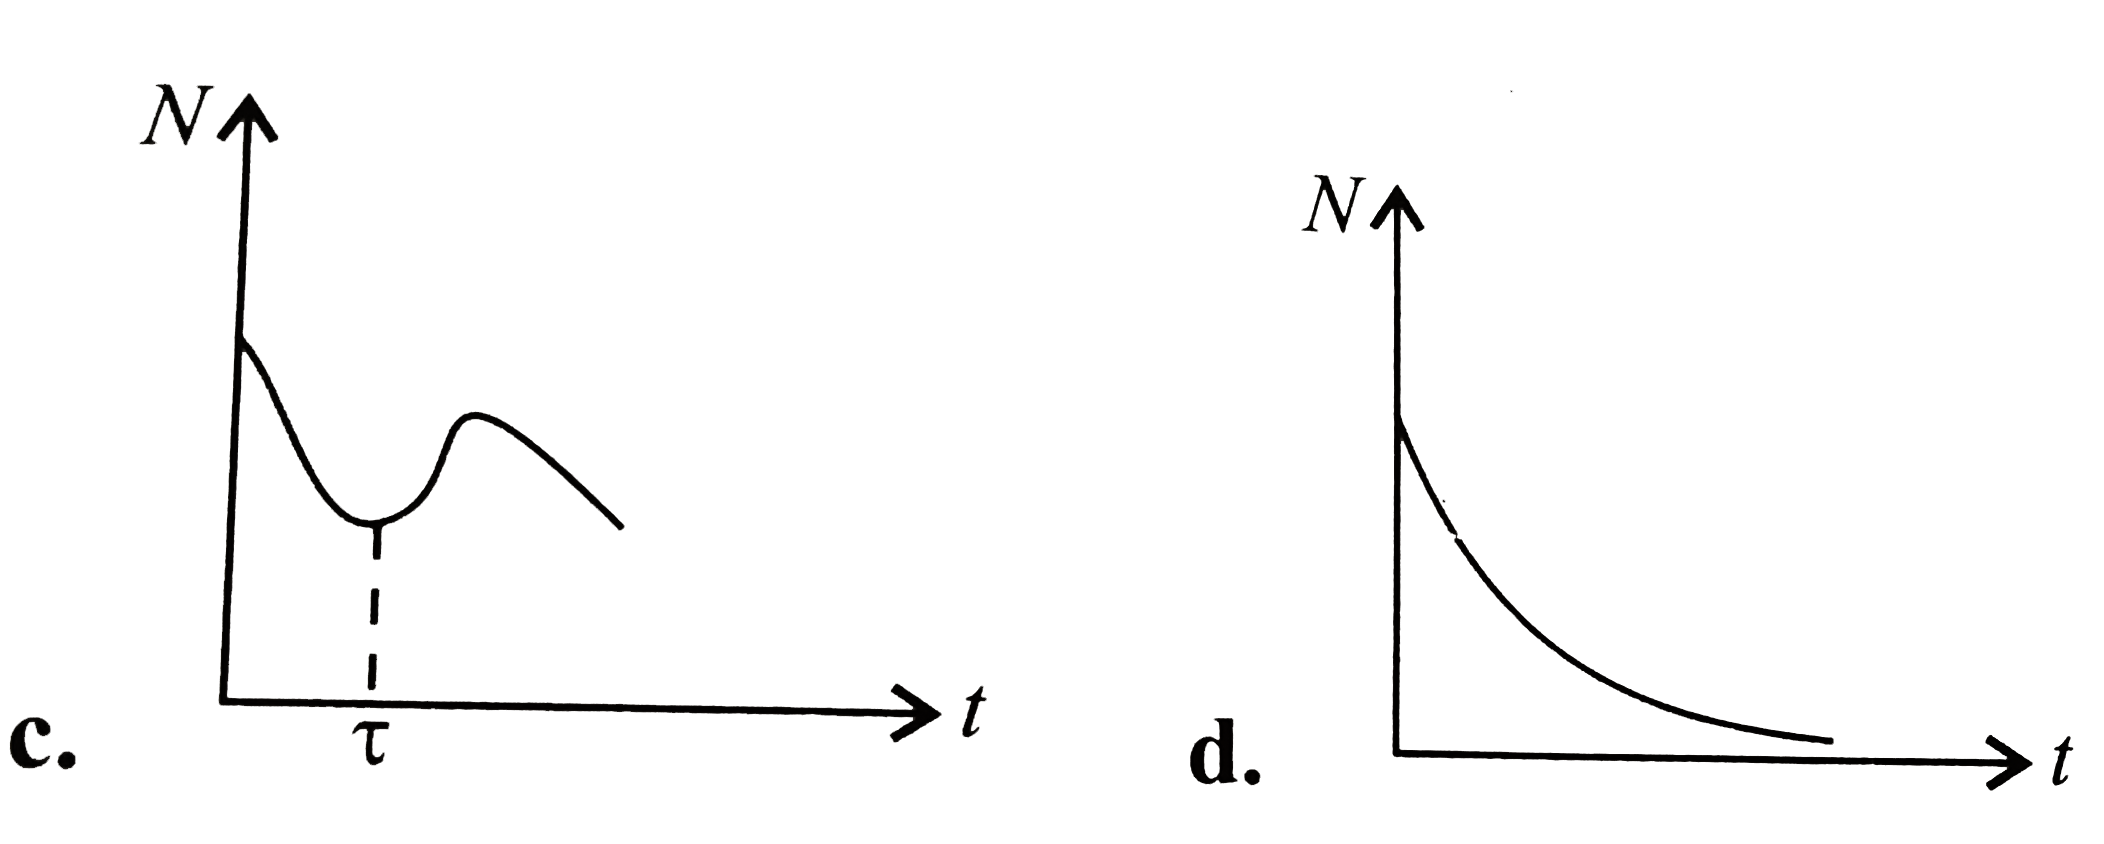
- A radioactive substance consists of two distinct having equal number o...
Text Solution
|
- A radicactive sample consider of two distinct species having equial nu...
Text Solution
|
- A radioactive sample consists of two distinct species having equal num...
Text Solution
|
- A radioactive substance consists of two distinct having equal number o...
Text Solution
|
- The rate of decay (R ) of nuclei in a radioactive sample is plotted ag...
Text Solution
|
- Consider a radioactive nucleus A which decays to a stable nucleus C th...
Text Solution
|
- The plot of the number (N) of decayed atoms versus activity (R) of a r...
Text Solution
|
- एक रेडियोएक्टिव नमूने में दो विभ्भिन उपजातियां है जिनमे प्रारम्भ में...
Text Solution
|
- A radioactive substance (A) is not produced at a constant rate which d...
Text Solution
|