


Similar Questions
Explore conceptually related problems
Recommended Questions
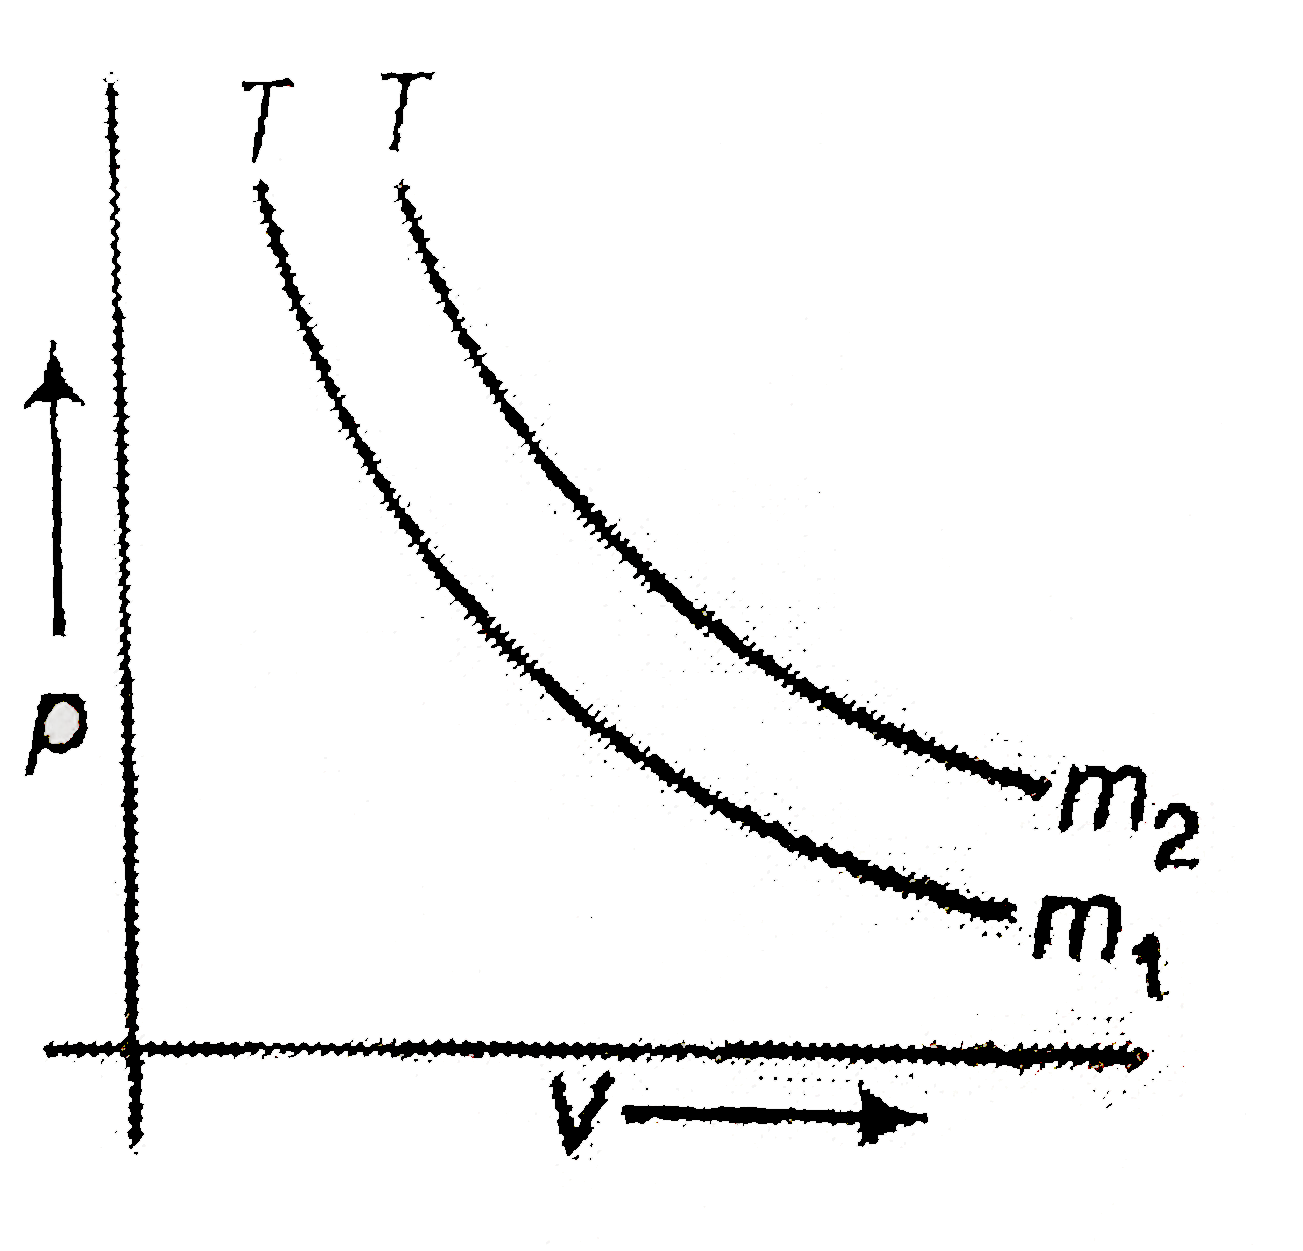
- The figure shown, the p-V diagram of two different masses m(1) and m(2...
Text Solution
|
- Figure shows a block of mass m(1) sliding on a block of mass m(2) , wi...
Text Solution
|
- Two block of masses m(1) and m(2) are connected as shown in the figure...
Text Solution
|
- Two blocks of mass m(1) and m(2) (m(1) lt m(2)) are connected with an ...
Text Solution
|
- Two masses m(1) and m(2) are attached to a spring balance S as shown i...
Text Solution
|
- The figure shown, the p-V diagram of two different masses m(1) and m(2...
Text Solution
|
- Two different isotherms representing the relationship between pressure...
Text Solution
|
- Two masses m(1) and m(2) are attached to a spring balance S as shown i...
Text Solution
|
- For same mass of two different ideal gases of molecular weights M(1) a...
Text Solution
|