


NARAYNA-ALTERNATING CURRENT-LEVEL - II(H.W)
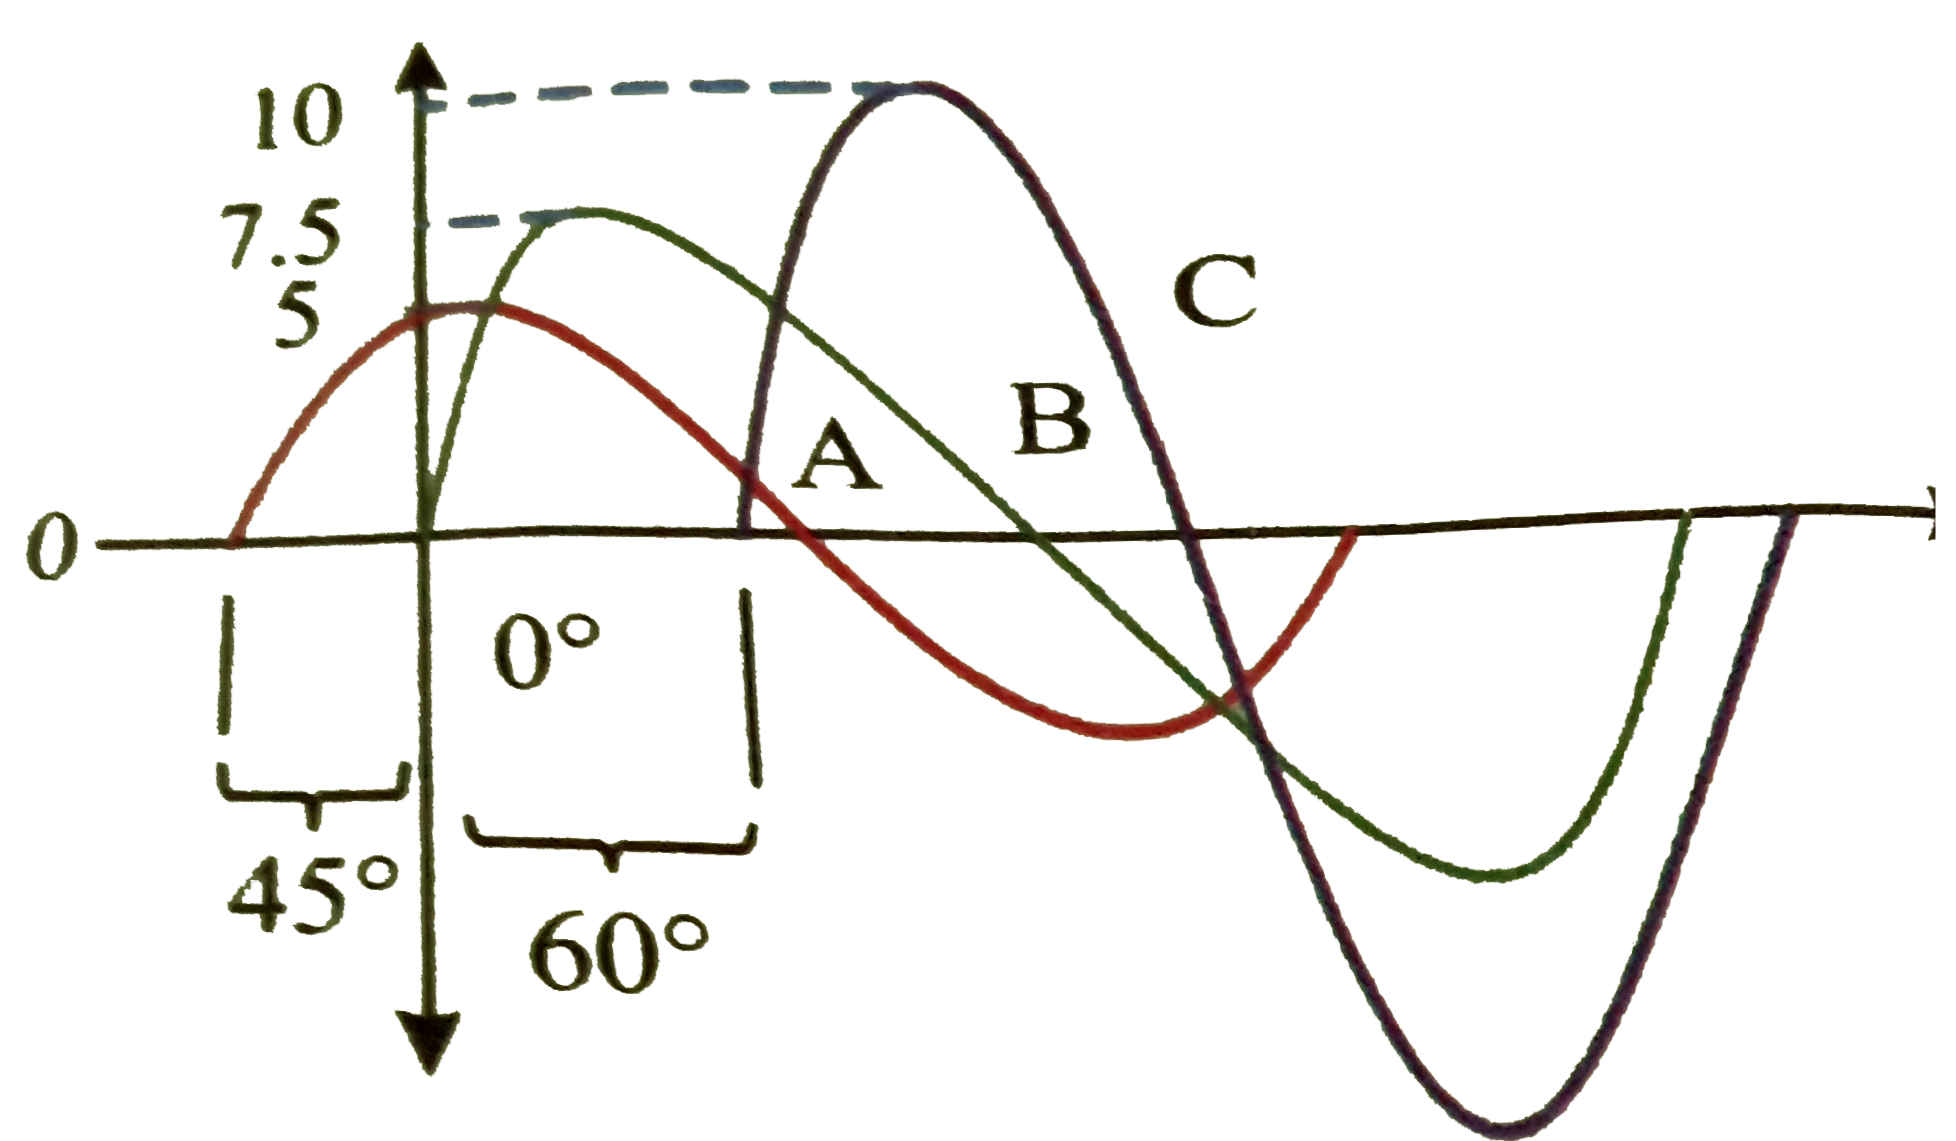
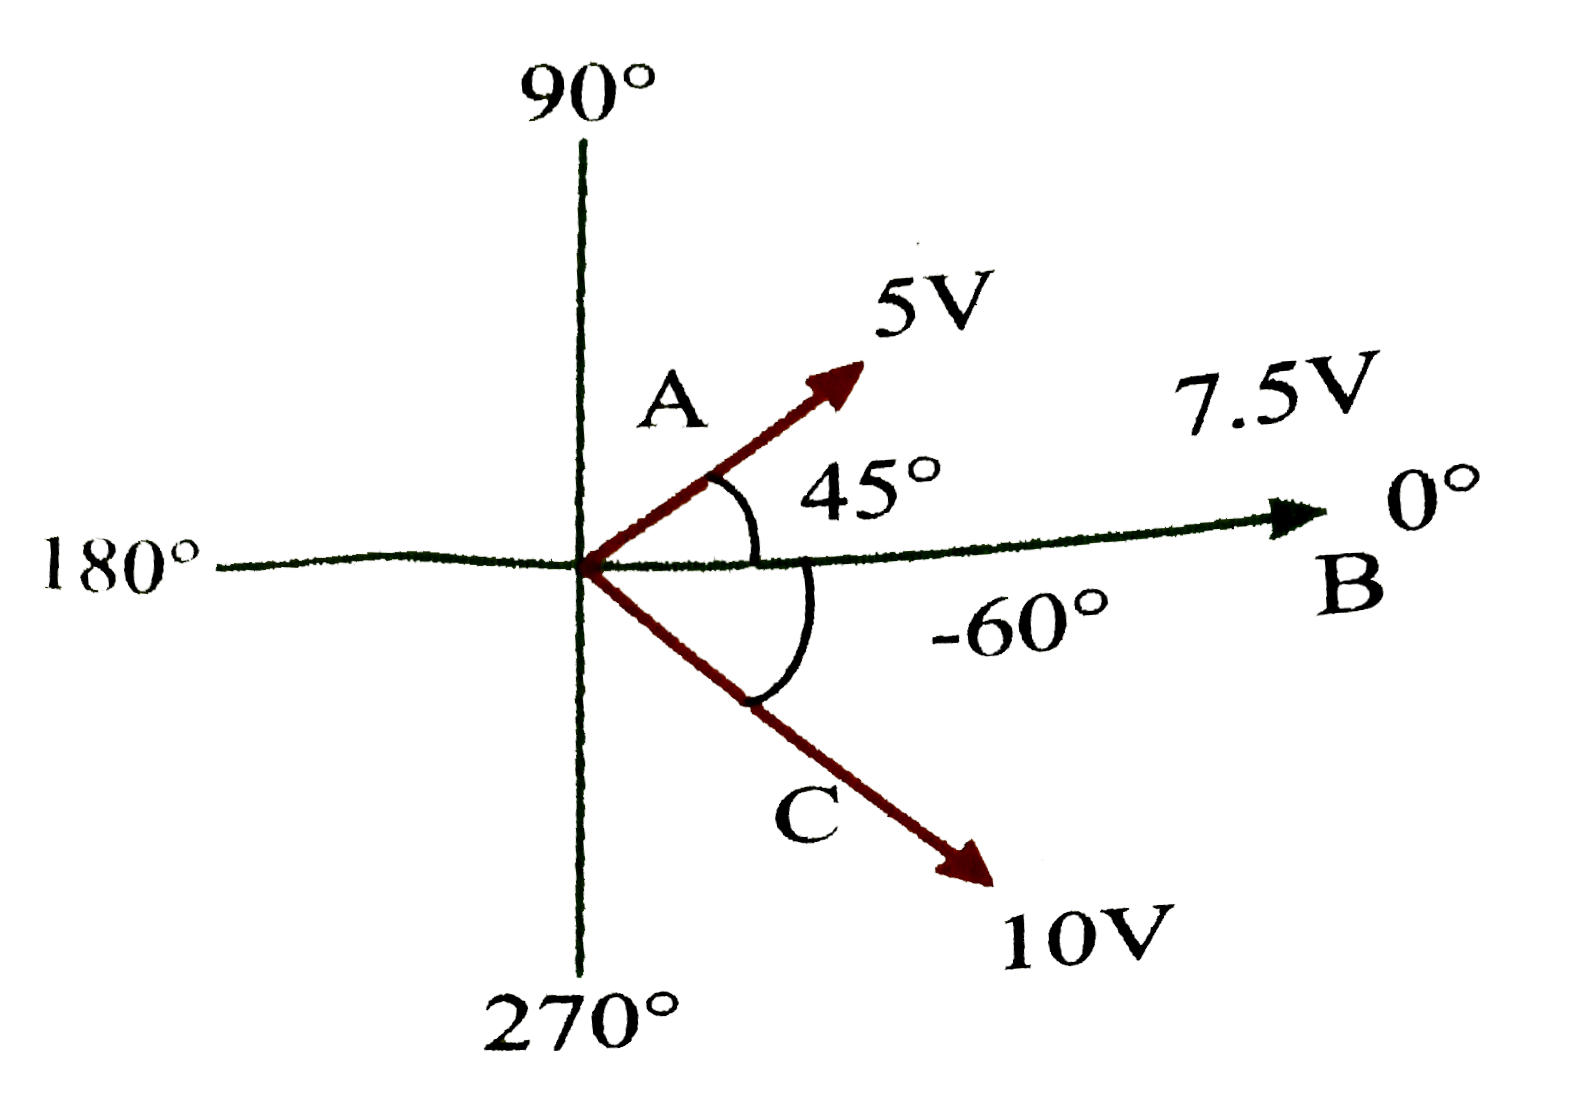
- Use a phasor diagram to represent the sine waves in the following Figu...
Text Solution
|
- An alternating current 'I' is given by I = i(0) sin 2 pi (t//T + 1//4)...
Text Solution
|
- In an LR circuit, R = 100 Omega and L = 2 H. If an alternating voltage...
Text Solution
|
- The equation of an alternating current is I = 50 sqrt(2) sin 400 pi t ...
Text Solution
|
- A circuit operating at 360/(2pi) Hz contains a 1muF capacitor and a 20...
Text Solution
|
- A resistor R and the capacitor C are connected in series across an ac ...
Text Solution
|
- An LCR series circuit containing a resistance of 12 Omega has angular ...
Text Solution
|
- The natural frequency of an LC- circuit is 1,25,000 cycles per second....
Text Solution
|
- In the given figure, the instantaneous value of alternating e.m.f. is ...
Text Solution
|
- A coil of inductance 0.1 H is connected to 50 V, 100Hz generator and c...
Text Solution
|
- The voltage of A.C source varies with tiem according equation. V = 12...
Text Solution
|
- The current in a coil of self inductance 5 henry in increasing accordi...
Text Solution
|
- In an AC circuit the voltage applied is E = E(0) sin omega t. The resu...
Text Solution
|
- The efficiency of a transformer is 98%. The primary voltage and curren...
Text Solution
|