Home
Class 11
BIOLOGY
Given diagram shows variations in the am...

Given diagram shows variations in the amount of DNA of a developing eukaryote. What the arrow denotes?

A

First meiotic anaphase

B

Second meiotic anaphase

C

Mitotic anaphase

D

Mitotic telophase

Text Solution

Verified by Experts

The correct Answer is:
B

The given graph shows variations in the DNA content in the cells of a eukaryote. Hploid set of chromosomes 1C is present in gamete which on fertilisation with gamete of opposite sex acquires diploid set of chormosomes (2C) and transforms into embryo embryo develops and grows into diplid organism by multiple mitotic divisions. During sexual reproduction gamete formation takes place by meiotic divison under which amount of DNA (2C) increases to 4C during S phase, which in first meiotic divison reduces to half i.e., 2C, divided among two daughter cells wheresas chormosomal number reduces to half i.e., from 2n to n. During second meiotic division, the amont of DNA is further distriuted equally from each daughter cells from first meiotic division ) to two daughter cells. The second meiotic division is equational, therefore the number of chromosome remains the same as produced at the end of meiosis I. Thus at the end of meiosis-II, each of the four haploid daughter cells contains one copy of every chromosme in the set (1C), rather two.
Promotional Banner

Topper's Solved these Questions

  • CELL - THE UNIT OF LIFE

    NCERT FINGERTIPS|Exercise Cell - The Unit Of Life|159 Videos
  • CHEMICAL COORDINATION AND INTEGRATION

    NCERT FINGERTIPS|Exercise Chemical Coordination And Integration|135 Videos

Similar Questions

Explore conceptually related problems

The given graph shows variation (with distance r from centre) of:

The given graph shows variation (with distance r from centre) of:

The given graph shows variation (with distance r form center) of :

The haploid amount of DNA in a eukaryotic cell is termed :

The given diagram shows the transportation of materials by

The given diagram is showing hydrophily of

Which of the following graphs shows the relative change in the amount of mitochondrial DNA of a cell undergoing mitosis?

Observe the given diagram and explain the rural urban composition in the developed and developing countries of the world.

NCERT FINGERTIPS-CELL CYCLE AND CELL DIVISION-Cell Cycle And Cell Division
  1. Which of the following graphs shows the relative change in the amount ...

    Text Solution

    |

  2. The given figure is a schematic break-up of the phases/stages of cell ...

    Text Solution

    |

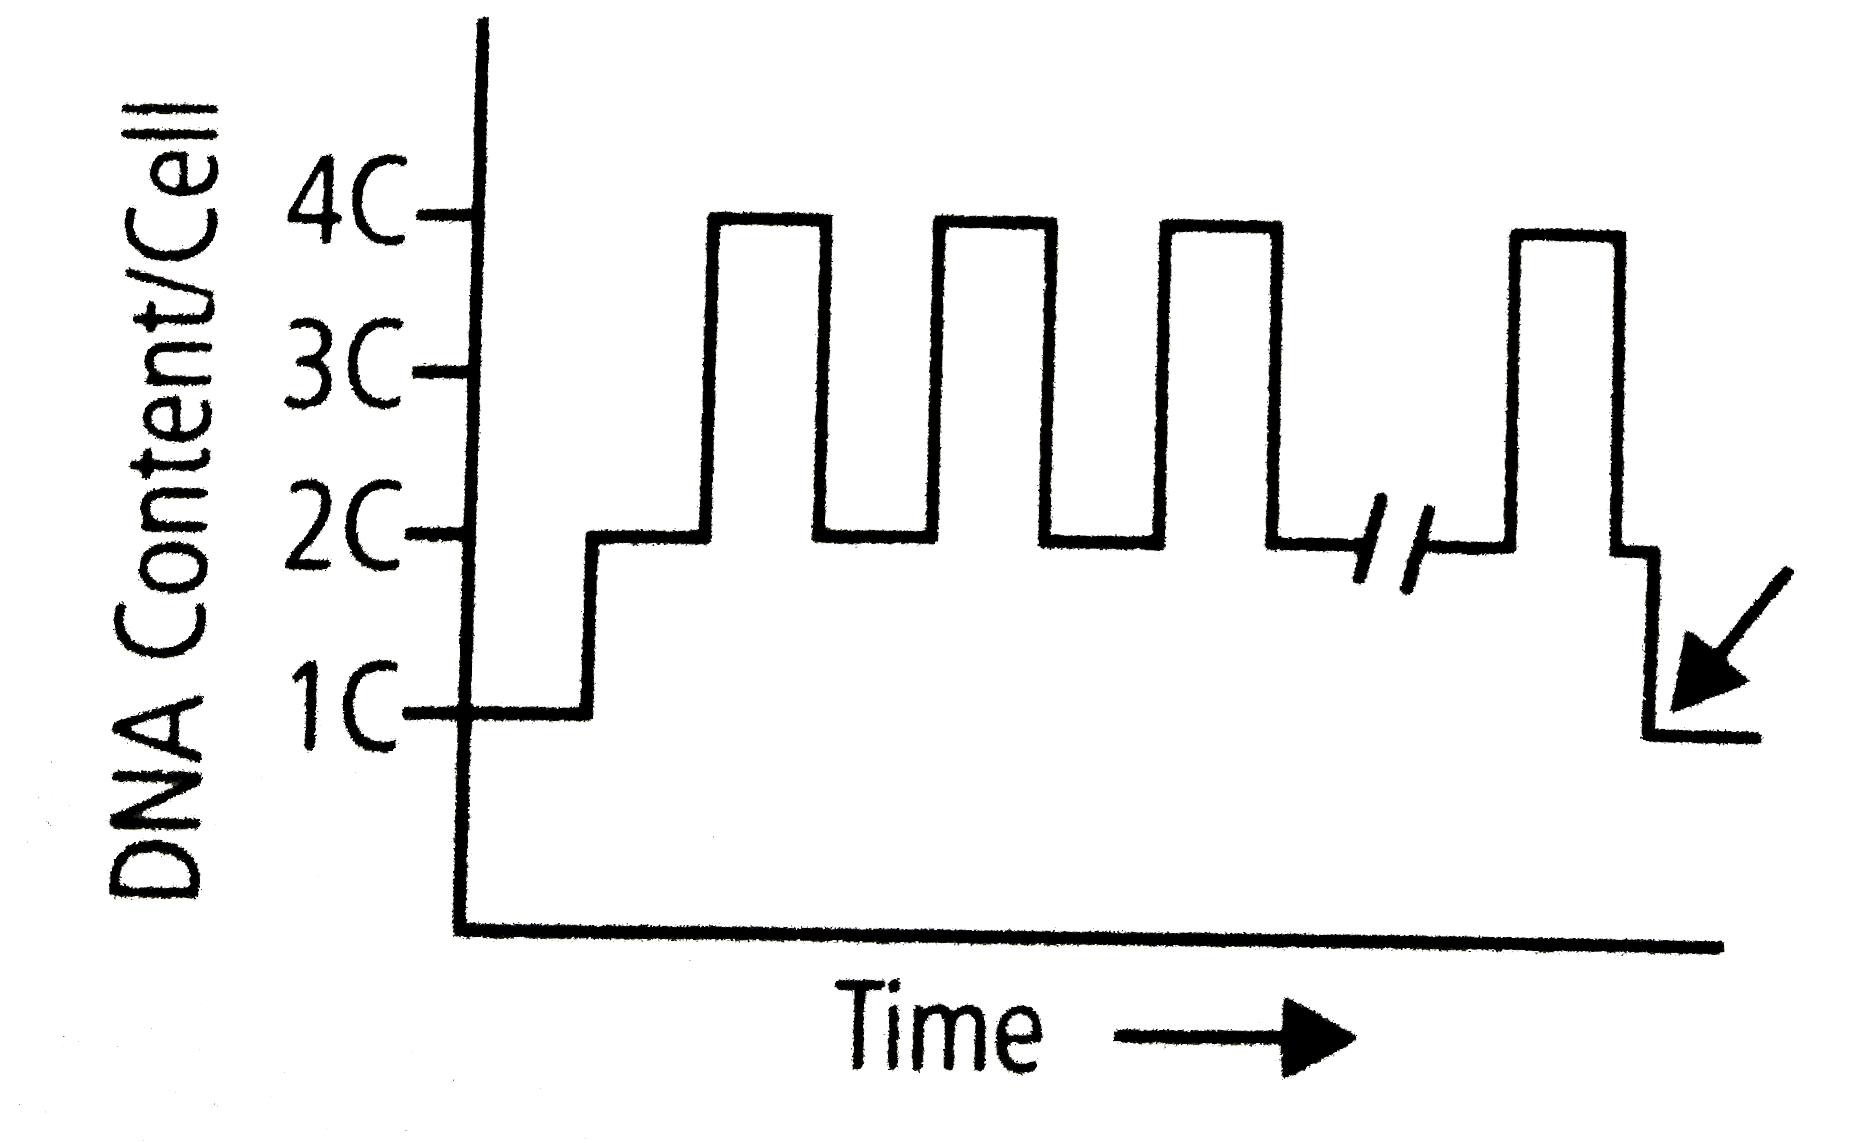
  3. Given diagram shows variations in the amount of DNA of a developing eu...

    Text Solution

    |

  4. Meiosis in diploid organisms results in

    Text Solution

    |

  5. At which stage of meiosis does the genetic constitution of gametes is ...

    Text Solution

    |

  6. Meiosis occurs in organisms during

    Text Solution

    |

  7. During anaphase I of meiosis

    Text Solution

    |

  8. Mitosis is characterised by

    Text Solution

    |

  9. A bivalent of meiosis i consists of

    Text Solution

    |

  10. Cells which are not dividing are likely to be at

    Text Solution

    |

  11. Which of the events listed below is not observed ruing mitosis?

    Text Solution

    |

  12. Identify the wrong statement about meiosis.

    Text Solution

    |

  13. Select the correct statement about G(1) phase.

    Text Solution

    |

  14. Assertion : Interphase occupies 75-95% of the total generation time. ...

    Text Solution

    |

  15. Assertion: Some cells enter G(0) phase leading to inactivation of cell...

    Text Solution

    |

  16. Assertion: G(1) phase is the interval between mitosis and initiation o...

    Text Solution

    |

  17. Assertion: Prophase is the first stage of mitosis which follows S and ...

    Text Solution

    |

  18. Assertion: Small disc-shaped structures at the surface of the centrome...

    Text Solution

    |

  19. Assertion: During anaphase, centromere of each chromosome splits and c...

    Text Solution

    |

  20. Assertion: Karyokinesis follows cytokinesis. Reason: Karyokinesis is...

    Text Solution

    |