


Similar Questions
Explore conceptually related problems
Recommended Questions
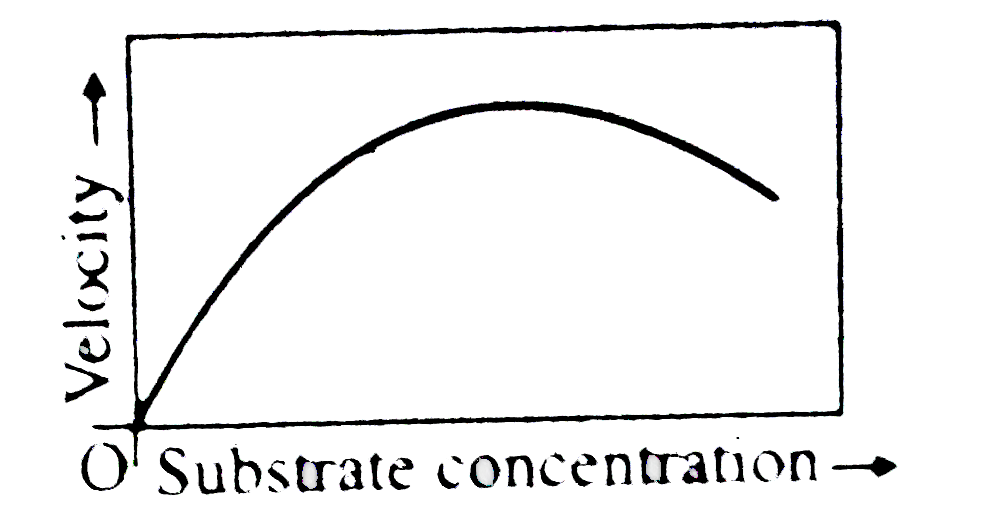
- The given graph shows the effect of substrate concentration on the ra...
Text Solution
|
- The given graph shows the effect of substrate concentration on the rat...
Text Solution
|
- The given graph shows the effect of substrate concentration on the ra...
Text Solution
|
- the graph given in Fig.9.36 shows the effect of substrate concentra...
Text Solution
|
- The given graph shows the effect of substrate concentration on the rat...
Text Solution
|
- The graph given below shows the effect of substrate concentration on t...
Text Solution
|
- Following graphs show the effect of change in concentration of substra...
Text Solution
|
- What is denoted by X and Y in the given graph? {:("X","Y"),("1) ...
Text Solution
|
- टिटेनस रोग का कारक कौन है ?
Text Solution
|