


Similar Questions
Explore conceptually related problems
Recommended Questions
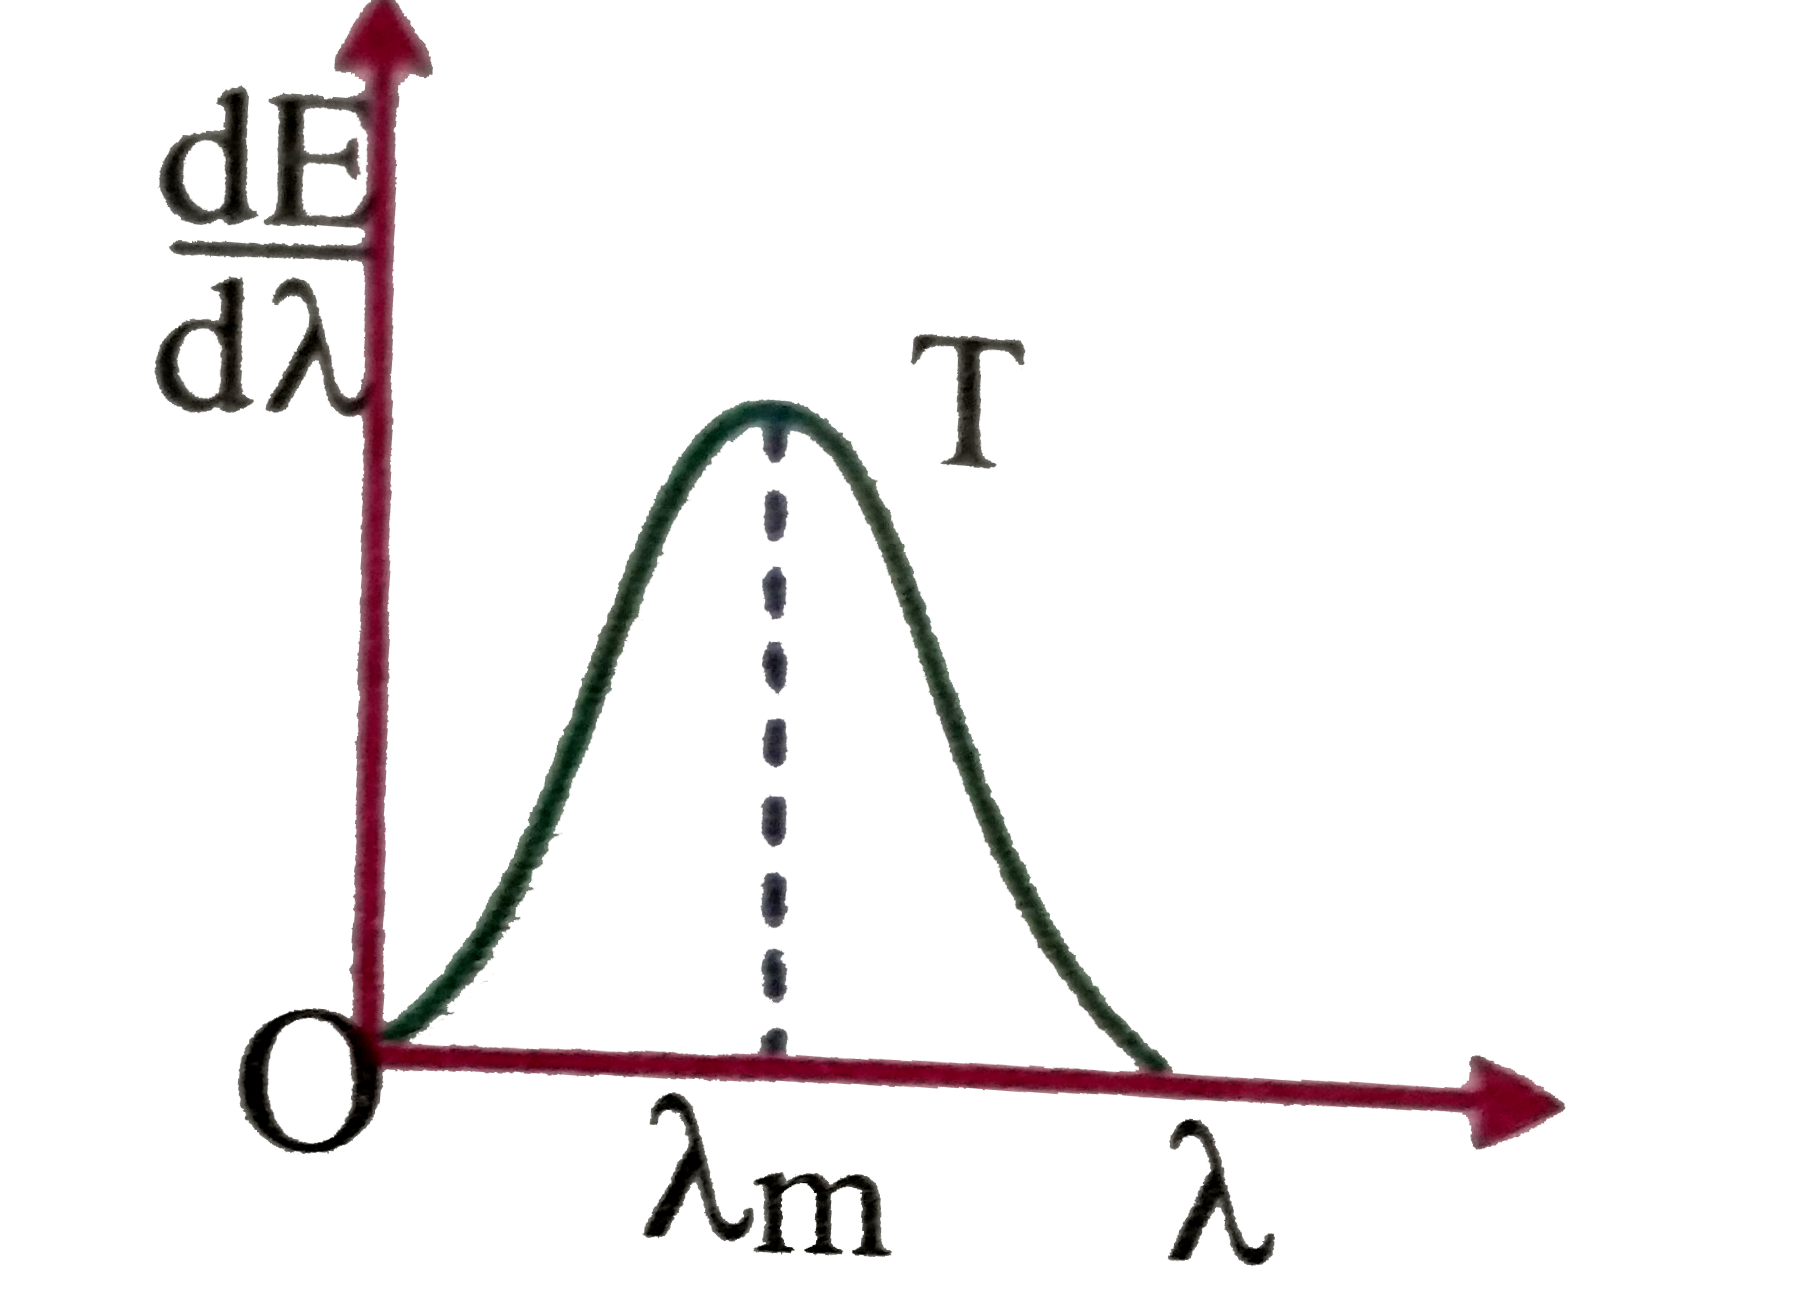
- The shows a radiant energy spectrum graph for a black body at at tempe...
Text Solution
|
- Distribution Of Energy In The Spectrum Of Black Body
Text Solution
|
- At high temperature black body spectrum is .
Text Solution
|
- The shows a radiant energy spectrum graph for a black body at at tempe...
Text Solution
|
- The shows a radiant energy spectrum graph for a black body at at tempe...
Text Solution
|
- A black body radiates energy at the rate of E "watt"//m^(2) at a high ...
Text Solution
|
- A black body radiates energy at the rate of E W//m at a high temperat...
Text Solution
|
- The original temperature of a black body is . 727^(@) C . The tempera...
Text Solution
|
- Statement-1: When the temperature of a black body is doubled from t^(@...
Text Solution
|