A
B
C
D
Text Solution
AI Generated Solution
The correct Answer is:


Topper's Solved these Questions
CHEMICAL KINETICS
PRADEEP|Exercise NCERT EXEMPLAR PROBLEMS WITH ANSWERS, HINTS AND SOLUTTIONS (SHORT ANSWER QUESTIONS)|20 VideosCHEMICAL KINETICS
PRADEEP|Exercise NCERT EXEMPLAR PROBLEMS WITH ANSWERS, HINTS AND SOLUTTIONS (MATCHING TYPE QUESTIONS)|3 VideosCHEMICAL KINETICS
PRADEEP|Exercise NCERT EXEMPLAR PROBLEMS WITH ANSWERS, HINTS AND SOLUTTIONS (MULTIPLE CHOICE QUESTIONS-1)|20 VideosBIOMOLECULES
PRADEEP|Exercise IMPORTANT QUESTIONS (FOR BOARD EXAMINATION)|25 VideosCHEMISTRY IN EVERYDAY LIFE
PRADEEP|Exercise IMPORTANT QUESTION FOR BOARD EXAMINATION|30 Videos
Similar Questions
Explore conceptually related problems
PRADEEP-CHEMICAL KINETICS-NCERT EXEMPLAR PROBLEMS WITH ANSWERS, HINTS AND SOLUTTIONS (MULTIPLE CHOICE QUESTIONS-II)
- Rate law cannot be determined form balanced chemical equation if â...
Text Solution
|
- Which of the following statements are applicable to a balanced chem...
Text Solution
|
- In any unimolecular reaction
Text Solution
|
- For a complex reaction ……… .
Text Solution
|
- At high pressure the following reaction is zero order. " "2N...
Text Solution
|
- During decomposition of an activated complex
Text Solution
|
- According to Maxwell Boltzmann distribution of energy
Text Solution
|
- In the graph showing Maxwell Boltzmann distribution of energy ...........
Text Solution
|
- Which of the following statements are in accordance with the Arrhenius...
Text Solution
|
- Mark the incorrect statements.
Text Solution
|
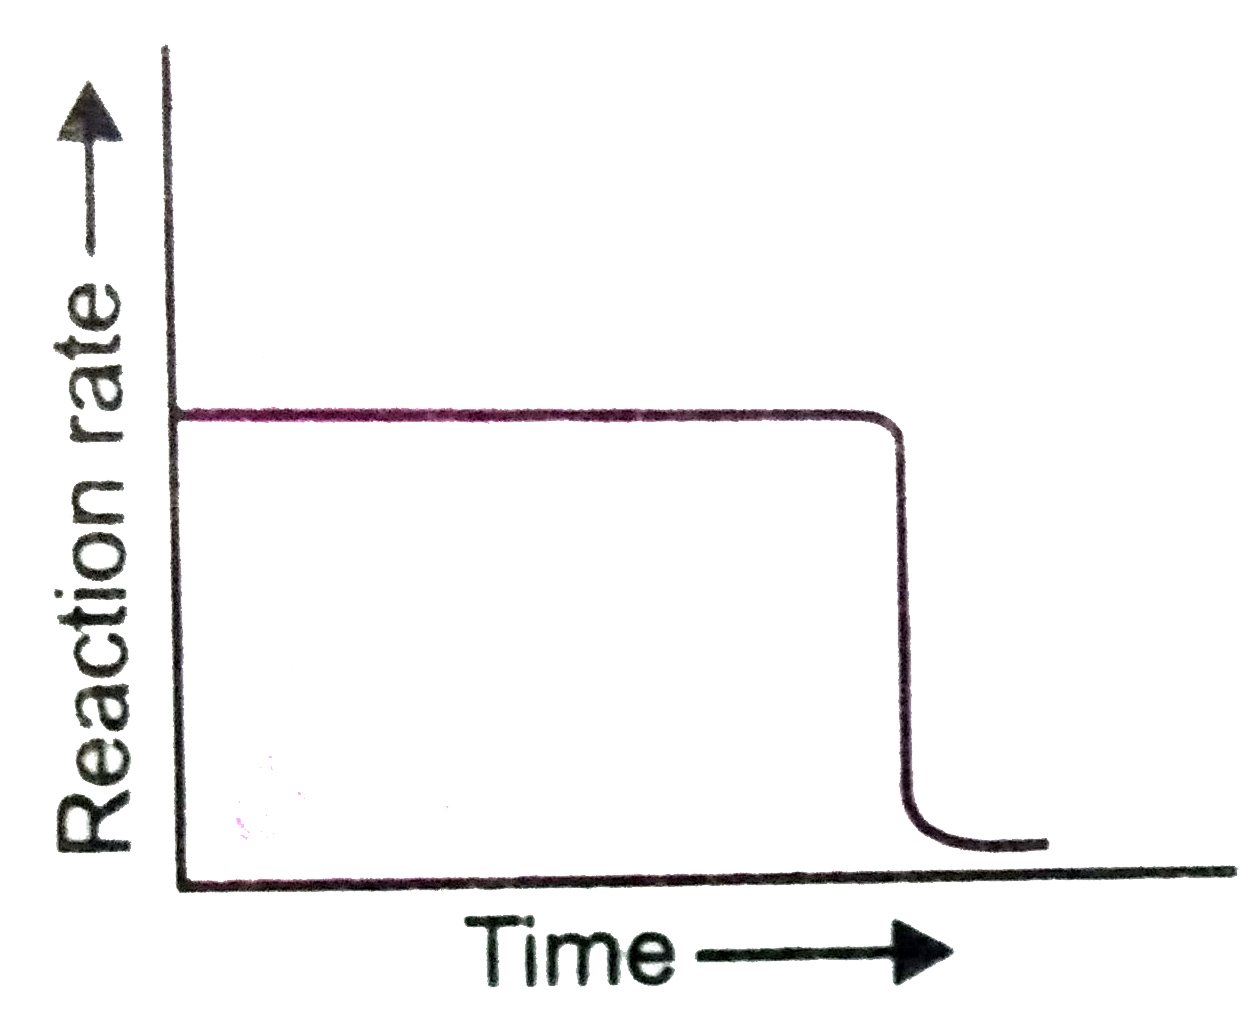
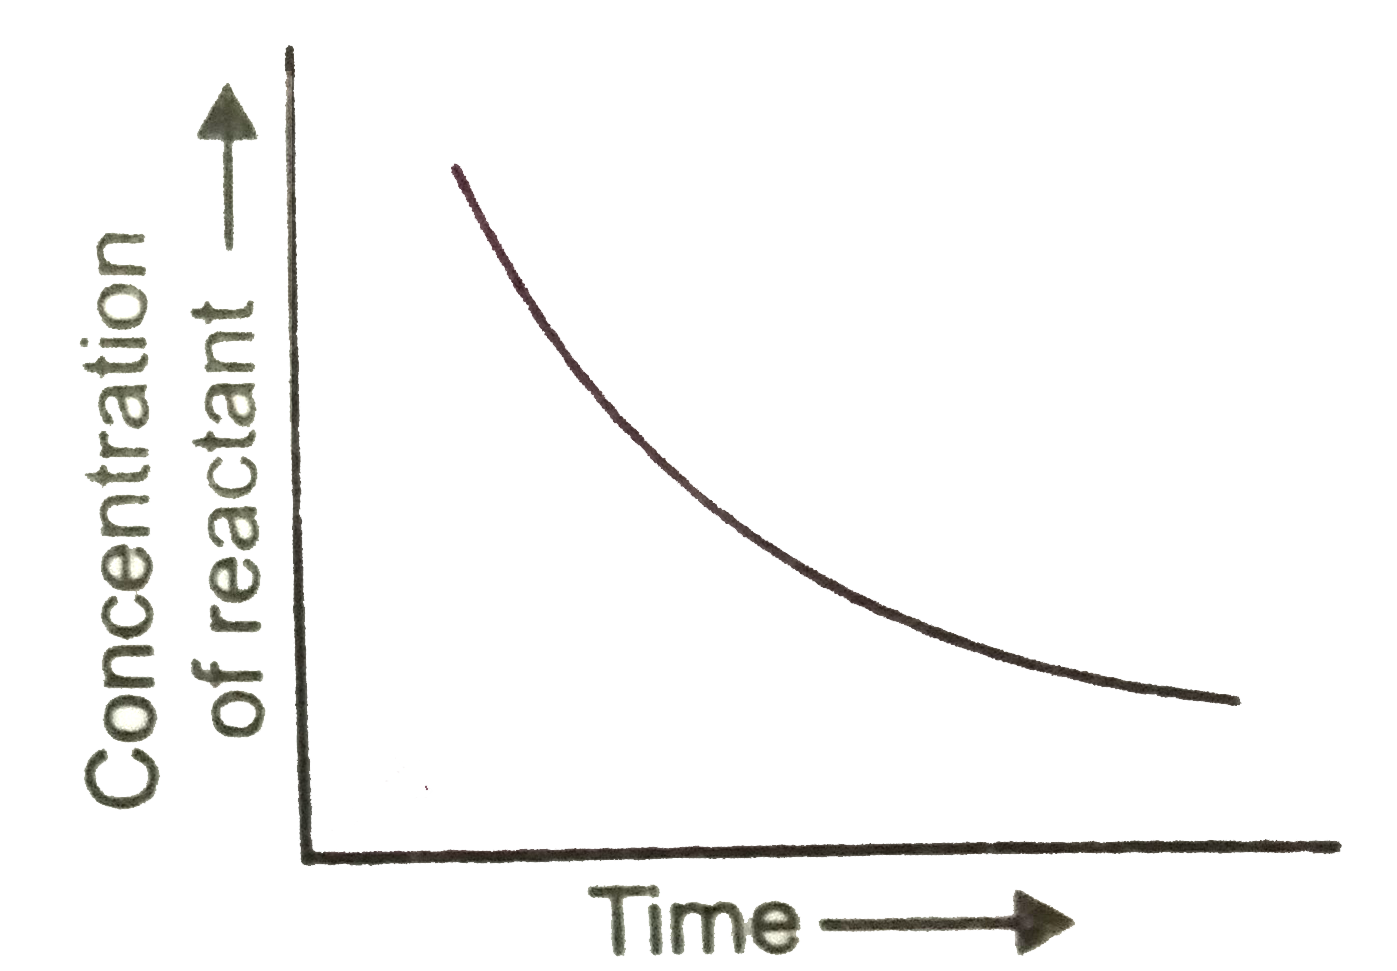
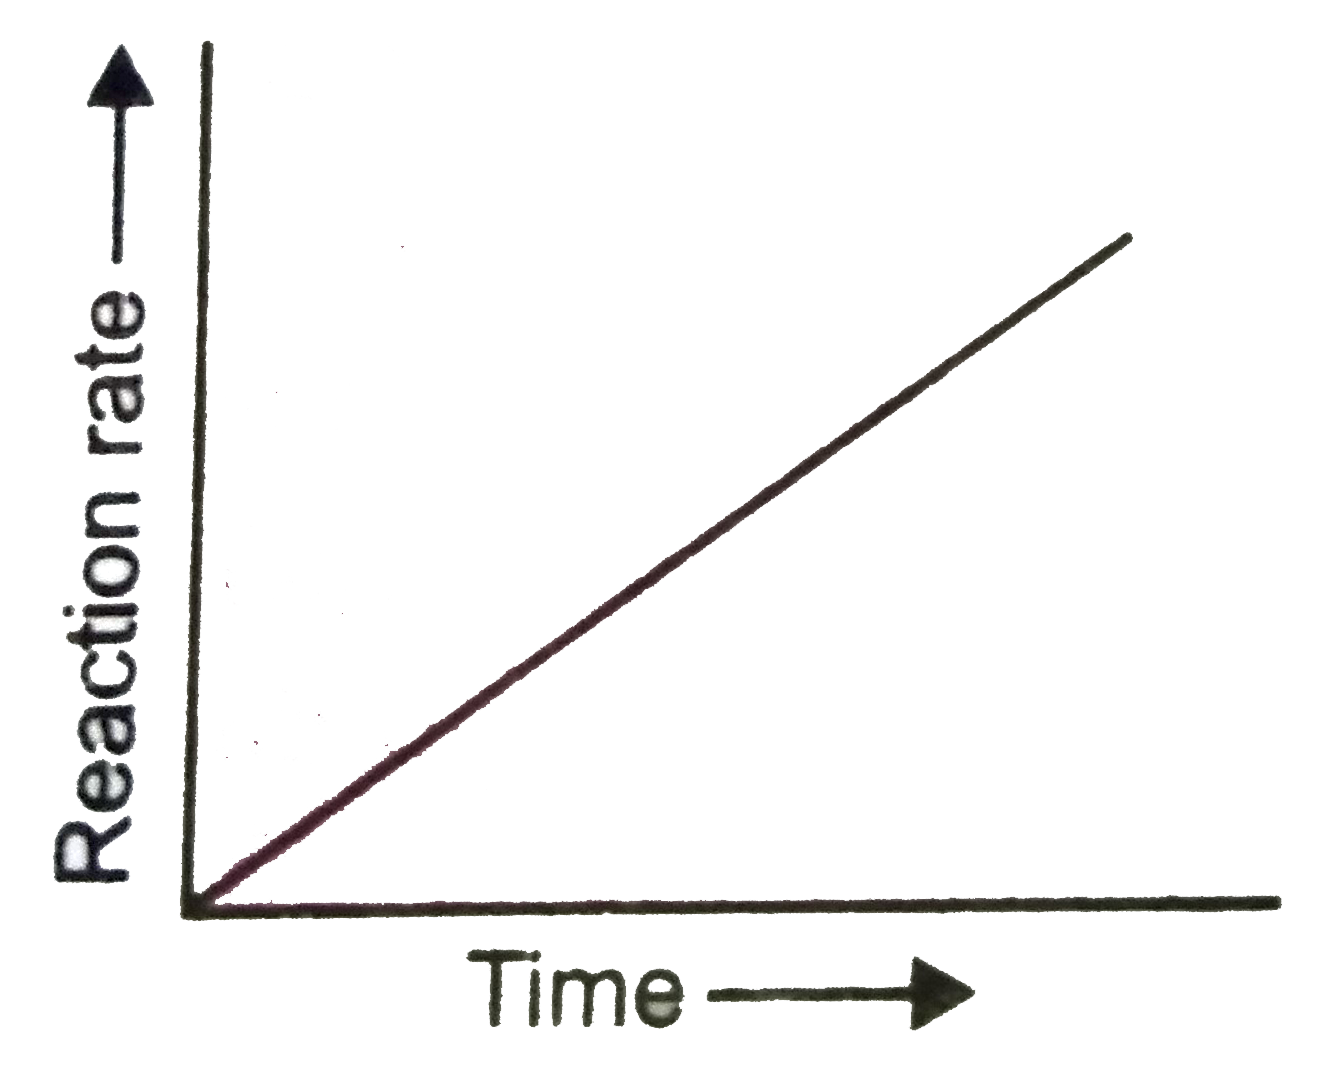
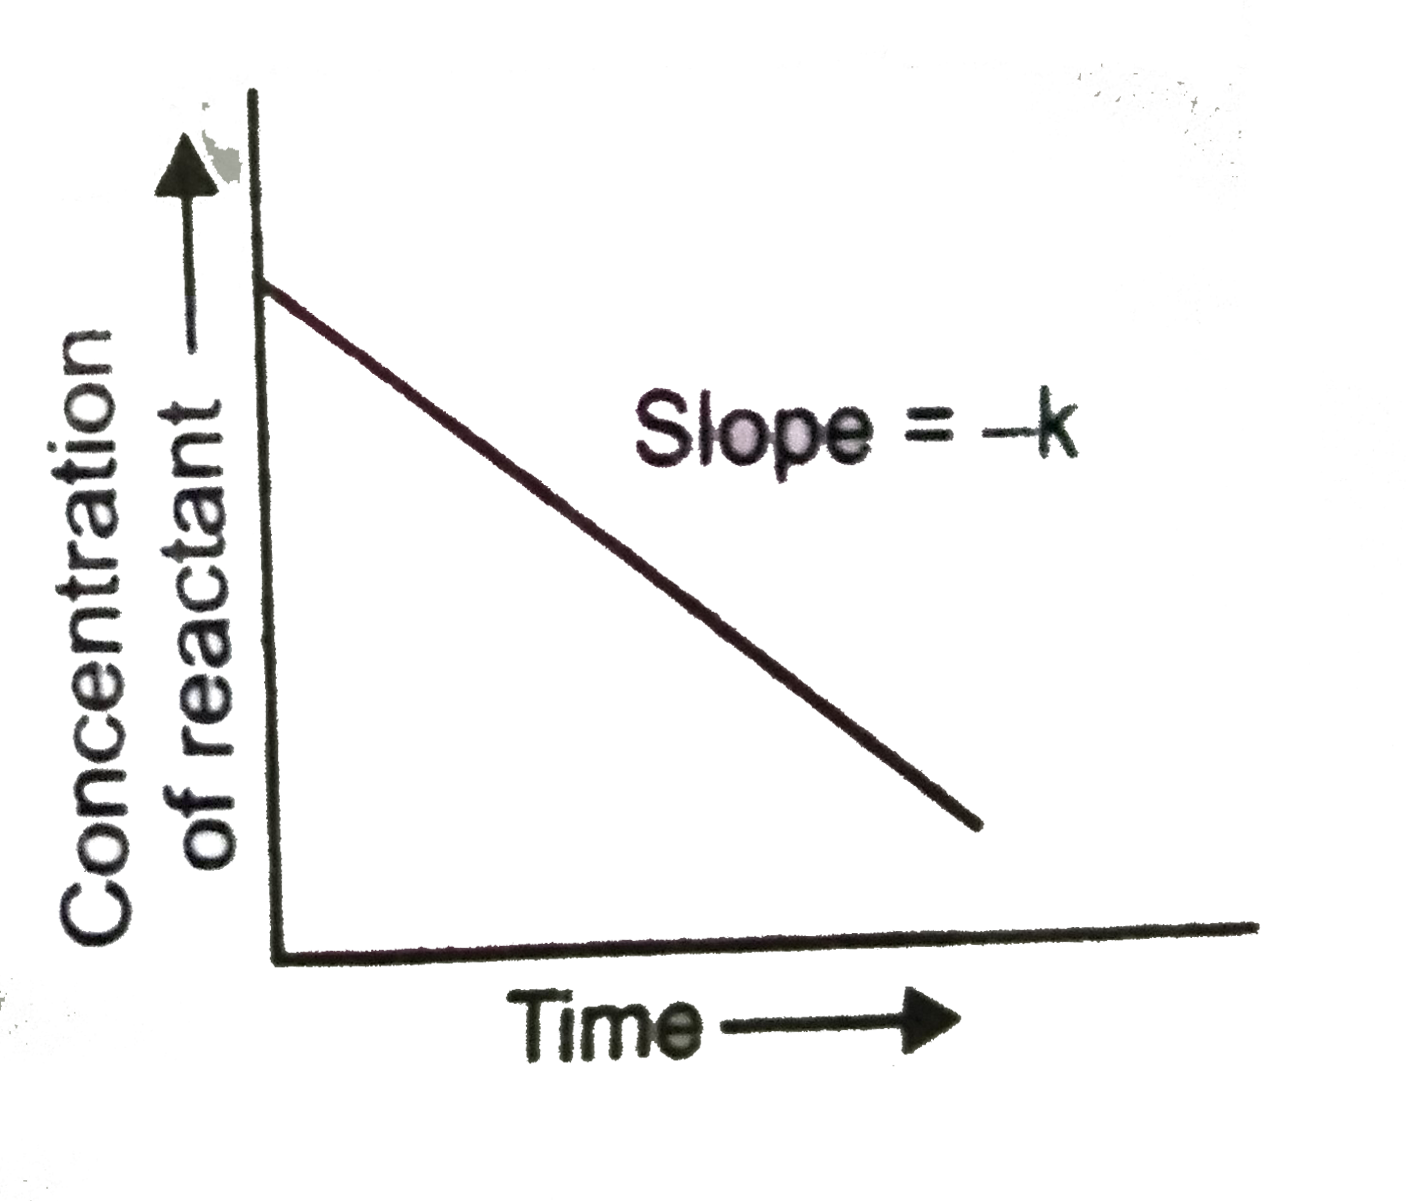
- Which of the following graphs is correct for a zero order reaction ?
Text Solution
|
- Which of the following graph is correct for a first order reaction ...
Text Solution
|