Home
Class 10
MATHS
The weekly observations on cost of livin...

The weekly observations on cost of living index in a certain city for the year 2004-2005 are given below. Compute the weekly cost of living index.
                            2

Promotional Banner

Topper's Solved these Questions

  • SOME APPLICATIONS OF TRIGONOMETRY

    RD SHARMA|Exercise All Questions|154 Videos
  • SURFACE AREAS AND VOLUMES

    RD SHARMA|Exercise All Questions|417 Videos

Similar Questions

Explore conceptually related problems

The year for which we calculate the cost of living index is referred as ___ year.

The cost of living index and the number of weeks are given in the following table. Find the mean cost of living index : Use step deviation method .

Calculate the cost of living indext for the year 2008 taking 2000 as the base year from the following information.

In a city, the weekly observations made on cost of living index are given below. One week is chosen at random. Find the probability that chosen week has cost of living greater than 150 but less than 170.

The cost of living indext for the year 2004 considering the base year as 2005 is Rs. 120. Find P.

Calculate the Cost of Living Index Number for the following data.

Three essential commoditites, the quantities of their consumption and their prices in the years 2006 and 2007 are listed below. The cost of living index for the years 2006 and 2007 is calculated on the prices of these three commodities only. ltimg src="https://d10lpgp6xz60nq.cloudfront.net/physics_images/PS_MATH_IX_C18_E06_002_Q01.png" width="80%"gt Find the cost of living index of the year 2007, taking 2006 as the bae year.

In a city of weekly observations made in a study on the cost of loving index are given in the following ta draw a frequency polygon (without constructing histogram )

RD SHARMA-STATISTICS-All Questions
  1. Find the mean of the following frequency distributions: Class interval...

    Text Solution

    |

  2. Find the mean of the following frequency distributions: Class interval...

    Text Solution

    |

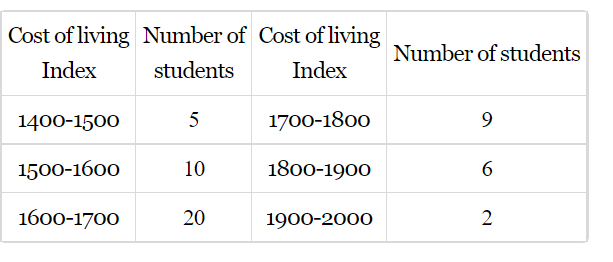
  3. The weekly observations on cost of living index in a certain city for ...

    Text Solution

    |

  4. The following table shows the marks scored by 140 students in an exam...

    Text Solution

    |

  5. The mean of the following frequency distribution is 62.8 and the sum o...

    Text Solution

    |

  6. The following distribution shows the daily pocket allowance given to ...

    Text Solution

    |

  7. If the mean of the following distribution is 27, find the value of p ....

    Text Solution

    |

  8. In a retail market, fruit vendors were selling mangoes kept in packing...

    Text Solution

    |

  9. The table below shows the daily expenditure on food of 25 households ...

    Text Solution

    |

  10. To find out the concentrations of S O2 in the air (in parts per mil...

    Text Solution

    |

  11. A class teacher has the following absentee record of 40 students of a ...

    Text Solution

    |

  12. The following table gives the literacy rate (in percentage) of 35 c...

    Text Solution

    |

  13. The following are the marks of 9 students in a class. Find the medi...

    Text Solution

    |

  14. Find the median of the daily wages of ten workers from the following ...

    Text Solution

    |

  15. Obtain the median for the following frequency distribution: x : 1 2 ...

    Text Solution

    |

  16. Calculate the median from the following distribution: Class:        5-...

    Text Solution

    |

  17. The median of the following data is 525. Find the values of x and y , ...

    Text Solution

    |

  18. If the median of the distribution given below is 28.5, find the value ...

    Text Solution

    |

  19. Following are the lives in hours of 15 pieces of the components of ...

    Text Solution

    |

  20. The following is the distribution of height of students of a certain ...

    Text Solution

    |