Home
Class 10
MATHS
A life insurance agent found the followi...

A life insurance agent found the following data for distribution of ages of 100 policy holders. Calculate the median age, if policies are only given to persons having age 18 years onwards but less than 60 years.

Promotional Banner

Topper's Solved these Questions

  • SOME APPLICATIONS OF TRIGONOMETRY

    RD SHARMA|Exercise All Questions|154 Videos
  • SURFACE AREAS AND VOLUMES

    RD SHARMA|Exercise All Questions|417 Videos

Similar Questions

Explore conceptually related problems

A life insurance agent found the following data for distribution of ages of 100 policy holders. Calculate the median age,if policies are given only to persons having age 18 years onwards but less than 60year.

A life insurance agent found the following data for distribution of ages of 100 policy holders. Calculate the median age, if policies are given only to persons having age 18 years onwards but less than 60 years. {:("Age (in years)","Number of policy holders","Age (in years)","Number of policy holders"),("Below 20"," "2,"Below 45"," "89),("Below 25"," "6,"Below 50"," "92),("Below 30"," "24,"Below 55"," "98),("Below 35"," "45,"Below 60"," "100),("Below 40"," "78,,):}

A life insurance agent found the following data for distribution of ages of 100 policy holders. A policy holder is chosen at random. Probability of policy holders chosen randomly of age less than 25 years is

A life insurance agent found the following data for distribution of ages of 100 policy holders. A policy holder is chosen at random. Find the sum of probabilities if a policy holder are chosen randomly of age (0-20) years and policy holders of age (25-30) years

A life insurance agent found the following data for distribution of ages of 100 policy holders. A policy holder is chosen at random. Find the difference between the probabili ties if policy holders are chosen randomly of age (30-35) years and of age (45-50) years.

Study the following graph and answer the question based on the graph. How many teachers are aged 45 years or more but less than 50 years?

Study the given graph and answer the question that follows. The number of workers whose age is 32 years or more but less than 44 years is:

Study the given graph and answer the question that follows the number of workers whose age is 32 years or more but less than 44 years is:

RD SHARMA-STATISTICS-All Questions
  1. Compute the median for each of the following data:

    Text Solution

    |

  2. A survey regarding the height (in cm) of 51 girls of class X of a scho...

    Text Solution

    |

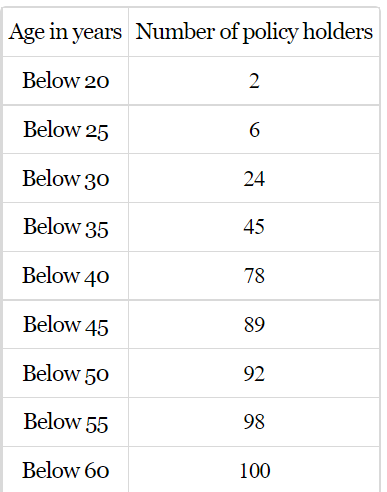
  3. A life insurance agent found the following data for distribution of ...

    Text Solution

    |

  4. The lengths of 40 leaves of a plant are measured correct to the neares...

    Text Solution

    |

  5. The following table gives the distribution of the life time of 400 neo...

    Text Solution

    |

  6. The distribution below gives the weight of 30 students in a class. Fin...

    Text Solution

    |

  7. Find the mode of the following data:  120, 110, 130, 110, 120, 140,...

    Text Solution

    |

  8. Compute the modal value for the following frequency distribution: x : ...

    Text Solution

    |

  9. The following data gives the distribution of total household expendi...

    Text Solution

    |

  10. The following table shows the age distribution of cases of a certain ...

    Text Solution

    |

  11. Find the mode of the following data: (i) 3, 5, 7, 4, 5, 3, 5, 6, 8, 9,...

    Text Solution

    |

  12. The shirt sizes worn by a group of 200 persons, who bought the shirt ...

    Text Solution

    |

  13. Find the mode of the following distribution:

    Text Solution

    |

  14. Compare the modal ages of two groups of students appearing for an ent...

    Text Solution

    |

  15. The following is the distribution of height of students of a certain ...

    Text Solution

    |

  16. The following table shows the ages of the patients admitted in a hos...

    Text Solution

    |

  17. The following data gives the distribution of total monthly household ...

    Text Solution

    |

  18. The following distribution gives the state-wise teacher-student ratio ...

    Text Solution

    |

  19. The following frequency distribution gives the monthly consumption of ...

    Text Solution

    |

  20. 100 surnames were randomly picked up from a local telephone directly ...

    Text Solution

    |