Home
Class 10
MATHS
The following data gives the distributio...

The following data gives the distribution of total household expenditure (in rupees) of manual workers in a city:

Find the average expenditure which is being done by the maximum number of manual workers.

Promotional Banner

Topper's Solved these Questions

  • SOME APPLICATIONS OF TRIGONOMETRY

    RD SHARMA|Exercise All Questions|154 Videos
  • SURFACE AREAS AND VOLUMES

    RD SHARMA|Exercise All Questions|417 Videos

Similar Questions

Explore conceptually related problems

The following table gives the distribution of total household expenditure (in rupees) of manual workers in a city. Expenditure (in rupees) (x_i) Frequency (f_i) 100-150 24 150-200 40 200-250 33 250-300 28 300-350 30 350-450 22 400-450 16 450-500 7 Find the average expenditure (in rupees) per household.

The following table gives the distribution of total household expenditure (in rupees) of manual workers in a city. Expenditure: (in Rs.) 100-150 150-200 200-250 250-300 300-350 350-400 400-450 450-500 Frequency: 24 40 33 28 30 22 16 7 Find the average expenditure (in Rs.) per household.

The following data gives the distribution of total monthly household expenditure of 200 families of a village.Find the modal monthly expenditure of the families.Also,find the mean monthly expenditure:

In the following table, the total expenditure of the labourers of a city is given Find the average expenditure by deviation method.

Study the following table and answer the questions based on it. Below is the Household is Expenditure (in Thousand Rupees) per annum What is the average spending on Leisure per annum?

The following table gives the information of frequency distribution of weekly wages of 150 workers of a company. Find the mean of the weekly wages by 'step deviation' method.

The following pie chart 1 shows the percentage distribution of total number of tourists from China, Japan and Russia who went for different cities. Find the difference between the total number of tourists from Japan and Russia in city. T with the total number of tourists from Japan and Russia in city S ?

RD SHARMA-STATISTICS-All Questions
  1. Find the mode of the following data:  120, 110, 130, 110, 120, 140,...

    Text Solution

    |

  2. Compute the modal value for the following frequency distribution: x : ...

    Text Solution

    |

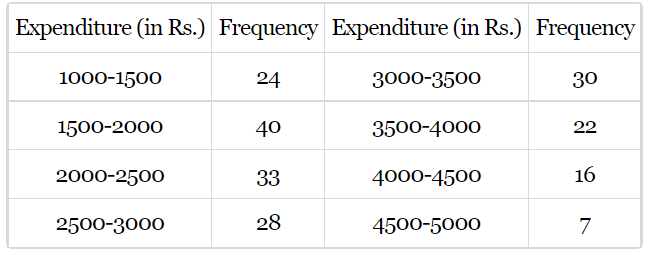
  3. The following data gives the distribution of total household expendi...

    Text Solution

    |

  4. The following table shows the age distribution of cases of a certain ...

    Text Solution

    |

  5. Find the mode of the following data: (i) 3, 5, 7, 4, 5, 3, 5, 6, 8, 9,...

    Text Solution

    |

  6. The shirt sizes worn by a group of 200 persons, who bought the shirt ...

    Text Solution

    |

  7. Find the mode of the following distribution:

    Text Solution

    |

  8. Compare the modal ages of two groups of students appearing for an ent...

    Text Solution

    |

  9. The following is the distribution of height of students of a certain ...

    Text Solution

    |

  10. The following table shows the ages of the patients admitted in a hos...

    Text Solution

    |

  11. The following data gives the distribution of total monthly household ...

    Text Solution

    |

  12. The following distribution gives the state-wise teacher-student ratio ...

    Text Solution

    |

  13. The following frequency distribution gives the monthly consumption of ...

    Text Solution

    |

  14. 100 surnames were randomly picked up from a local telephone directly ...

    Text Solution

    |

  15. Find the mean, median and mode of the following data:

    Text Solution

    |

  16. Find the mean, median and mode of the following data:

    Text Solution

    |

  17. The following table gives the daily income of 50 workers of a factory:...

    Text Solution

    |

  18. Draw an ogive by less than method for the following data: No. of rooms...

    Text Solution

    |

  19. The marks scored by 750 students in an examination are given in the ...

    Text Solution

    |

  20. Draw an ogive to represent the following frequency distribution: Class...

    Text Solution

    |