Home
Class 10
MATHS
The following table shows the ages of th...

The following table shows the ages of the patients admitted in a hospital during a year:

Find the mode and the mean of the data given above. Compare and interpret the two measures of central tendency.

Promotional Banner

Topper's Solved these Questions

  • SOME APPLICATIONS OF TRIGONOMETRY

    RD SHARMA|Exercise All Questions|154 Videos
  • SURFACE AREAS AND VOLUMES

    RD SHARMA|Exercise All Questions|417 Videos

Similar Questions

Explore conceptually related problems

The following frequency dsitribution table gives the ages of 80 patients treated in a hospital during a month. Find the mode of the ages of the patients.

The following table shows ages of 300 patients getting medical treatment in a hospital on a particular day: Find the median age of the patient.

The following frequency distribution table gives the ages of 200 patients treated in a hospital in a weak. Find the mode of ages of the patients.

The following frequency distribution table gives the ages of 200 patients treated in a hospital in a week. Find the mode of ages of the patients.

Find the mean of the data given in the following table :

The following table shows the number of patients of differents age groups admitted to a hospital for treatement on a day. Find the median age of the patients.

The following table shows ages of people who went to a particular play of circus in a day. Find the mode of the ages of the vistiors.

The following table shows the marks obtained by 100 students of Class X in a school during a particular academic session.Find the mode of this distribution.

RD SHARMA-STATISTICS-All Questions
  1. Compare the modal ages of two groups of students appearing for an ent...

    Text Solution

    |

  2. The following is the distribution of height of students of a certain ...

    Text Solution

    |

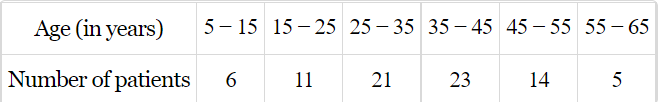
  3. The following table shows the ages of the patients admitted in a hos...

    Text Solution

    |

  4. The following data gives the distribution of total monthly household ...

    Text Solution

    |

  5. The following distribution gives the state-wise teacher-student ratio ...

    Text Solution

    |

  6. The following frequency distribution gives the monthly consumption of ...

    Text Solution

    |

  7. 100 surnames were randomly picked up from a local telephone directly ...

    Text Solution

    |

  8. Find the mean, median and mode of the following data:

    Text Solution

    |

  9. Find the mean, median and mode of the following data:

    Text Solution

    |

  10. The following table gives the daily income of 50 workers of a factory:...

    Text Solution

    |

  11. Draw an ogive by less than method for the following data: No. of rooms...

    Text Solution

    |

  12. The marks scored by 750 students in an examination are given in the ...

    Text Solution

    |

  13. Draw an ogive to represent the following frequency distribution: Class...

    Text Solution

    |

  14. The monthly profits (in Rs.) of 100 shops are distributed as follows: ...

    Text Solution

    |

  15. The following table gives the height of trees: Height                 ...

    Text Solution

    |

  16. The annual profits earned by 30 shops of a shopping complex in a lo...

    Text Solution

    |

  17. The following distribution gives the daily income of 50 workers of a ...

    Text Solution

    |

  18. The following table gives production yield per hectare of wheat of 100...

    Text Solution

    |

  19. Define mean.

    Text Solution

    |

  20. What is the algebraic sum of deviations of a frequency distribution ...

    Text Solution

    |