Home
Class 11
BIOLOGY
When two plants L and M were exposed to ...

When two plants L and M were exposed to different light intensities and temperature they showed changes in their rates of photosynthesis. Which have been represented in the following graph.

The graph indicates that

A

Plant L is a `C_(3)` plant for which the light saturation point is 100% of full sunlight

B

Plant M is a `C_(4)` plant for which the optimum temperature s around `20^(@)C`

C

Plant M is a `C_(3)` plant which is more affected at higher temperature and higher light intensity as compared to palnt L

D

plant L is a `C_(4)` plant and cannot function at light intensities above the saturation point.

Text Solution

Verified by Experts

The correct Answer is:
C

The light intensity at which a plant can achive maximum rate of photosynthesis is called as light saturation point. Its value is 50-70% full sunlight in `C_(3)` sun plants and upto 200% of full sunlight in `C_(4)` sun plants (e.g., sugarcane). Beyond satruation point (it is seldom relaised in nature in `C_(4)` sun plants). the rate of photosynthesis begins to decline. Optimum temperature at which the rate of photsynthesis is maximum is `10^(@)C-25^(@)C` for `C_(3)` plants and `30-45^(@)C` for `C_(4)` plants. Thus, it is clear that in the given graph, plant L is a `C_(4)` plant and plant M is a `C_(3)` plant.
Promotional Banner

Topper's Solved these Questions

  • NEURAL CONTROL AND COORDINATION

    NCERT FINGERTIPS|Exercise Neural Control And Coordination|167 Videos
  • PLANT GROWTH AND DEVELOPMENT

    NCERT FINGERTIPS|Exercise Plant Growth And Development|154 Videos

Similar Questions

Explore conceptually related problems

Study the given graph showing the efect of light intensity on the rate of photosynthesis. Which of the following statemetns regarding this is correct?

The graph showing rate of photosynthesis at different wavelength of light is called

Diagram below depicts an experiment to find the effect of temperature on the rate of photosynthesis. The average number of bubbles per minute at each temperature is given in the table. Plot a graph to show the relation between the rate of photosynthesis and temperature.

For the following temperature-time graph, in which region the state of material changes

Figure shows the acceleration-time graphs of a particle. Which of the following represents the corresponding velocity -time graph?

The temperature of a particular place is continuously decreasing. Which of the following graphs shows the condition?

The temperature of a particular place is continuously decreasing. Which of the following graphs shows the condition?

NCERT FINGERTIPS-PHOTOSYNTHESIS IN HIGHER PLANTS-Photosynthesis In Higher Plants
  1. The factor which is not limiting in normal conditions for photosynthes...

    Text Solution

    |

  2. Consider the following statements regarding starch and sucrose synthes...

    Text Solution

    |

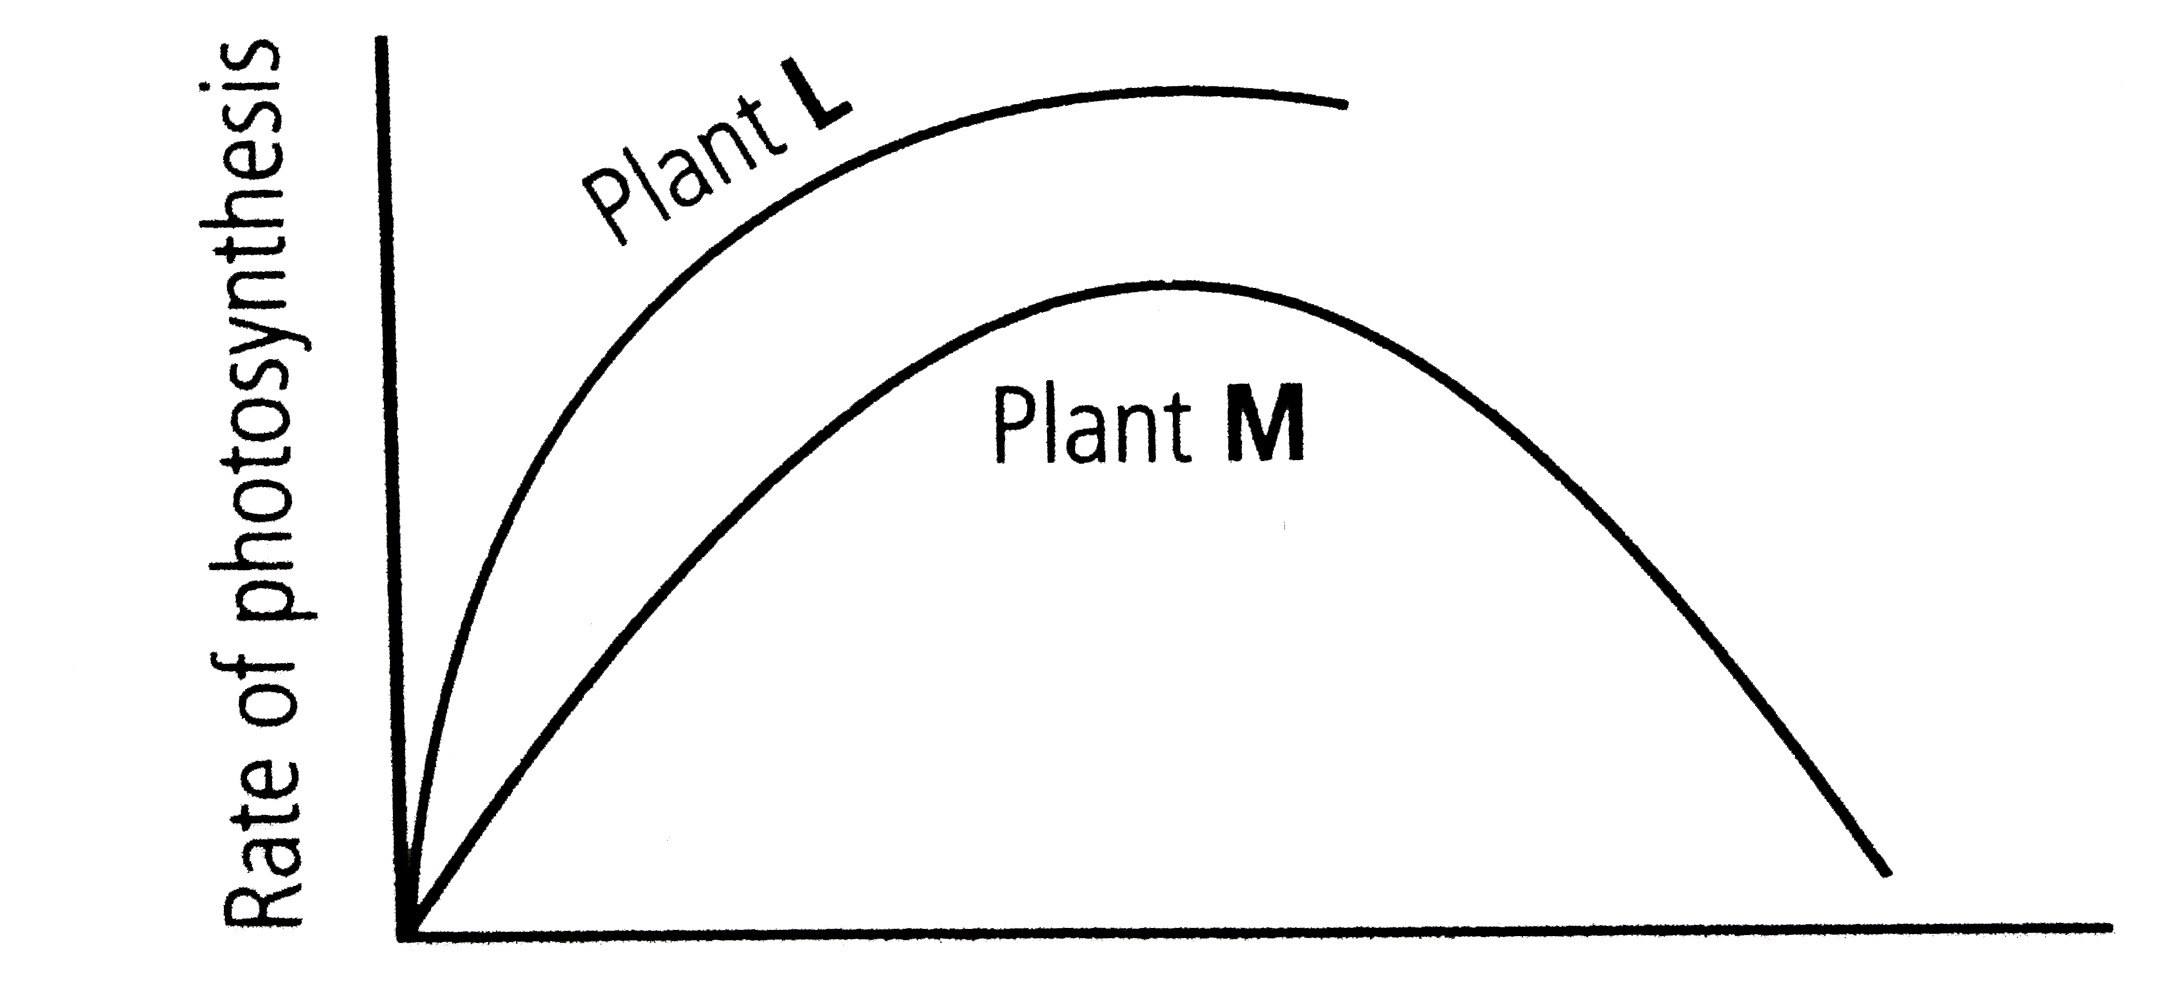
  3. When two plants L and M were exposed to different light intensities an...

    Text Solution

    |

  4. Refer to the given cross section of a C(4) leaf and select the incorre...

    Text Solution

    |

  5. When wheat and sugarcane leaves are fed with radioactive .^(14)CO(2). ...

    Text Solution

    |

  6. Which of the following equations holds true for acidification reaction...

    Text Solution

    |

  7. Which of the following graphs correctly depicts the rate of photosynth...

    Text Solution

    |

  8. A typical light response curve of photosynthesis is shown. The limitin...

    Text Solution

    |

  9. Which metal ion is a constituent of chlorophyll?

    Text Solution

    |

  10. Which pigment acts directly to convert light energy to chemical energy...

    Text Solution

    |

  11. Which range of wavelenght (in nm) is called photosyntehtically active ...

    Text Solution

    |

  12. Which light range is lest effective in phosynthesis?

    Text Solution

    |

  13. Chemosynthetic bacteria obtain energy from

    Text Solution

    |

  14. Energy required for ATP synthesis in PSII comes from

    Text Solution

    |

  15. During light reaction in photosynthesis the following are formed.

    Text Solution

    |

  16. Dark reaction in photosynthesis is called so because

    Text Solution

    |

  17. PEP is primary CO(2) acceptor in

    Text Solution

    |

  18. Splitting of water is associated with

    Text Solution

    |

  19. The correct sequency of flow of electons in the light reaction is

    Text Solution

    |

  20. The enzyme that is not found in a C(3) plant is

    Text Solution

    |