A
B
C
D
Text Solution
Verified by Experts
The correct Answer is:


Topper's Solved these Questions
Similar Questions
Explore conceptually related problems
NARAYNA-KINETIC THEORY OF GASES-LEVEL-3(C.W)
- A vessel of volume , V = 5.0 litre contains 1.4 g of nitrogen at a tem...
Text Solution
|
- The mass 15 gram of Nitrogen is enclosed in vessel at 300K. What heat ...
Text Solution
|
- At what absolute temperature 'I', is 'rms' speed of a hydrogen molecul...
Text Solution
|
- Determine the gas temperature at which (a) the root mean square velo...
Text Solution
|
- Two cylinder having m(1)g and m(2)g of a gas at pressure P(1) and P(2...
Text Solution
|
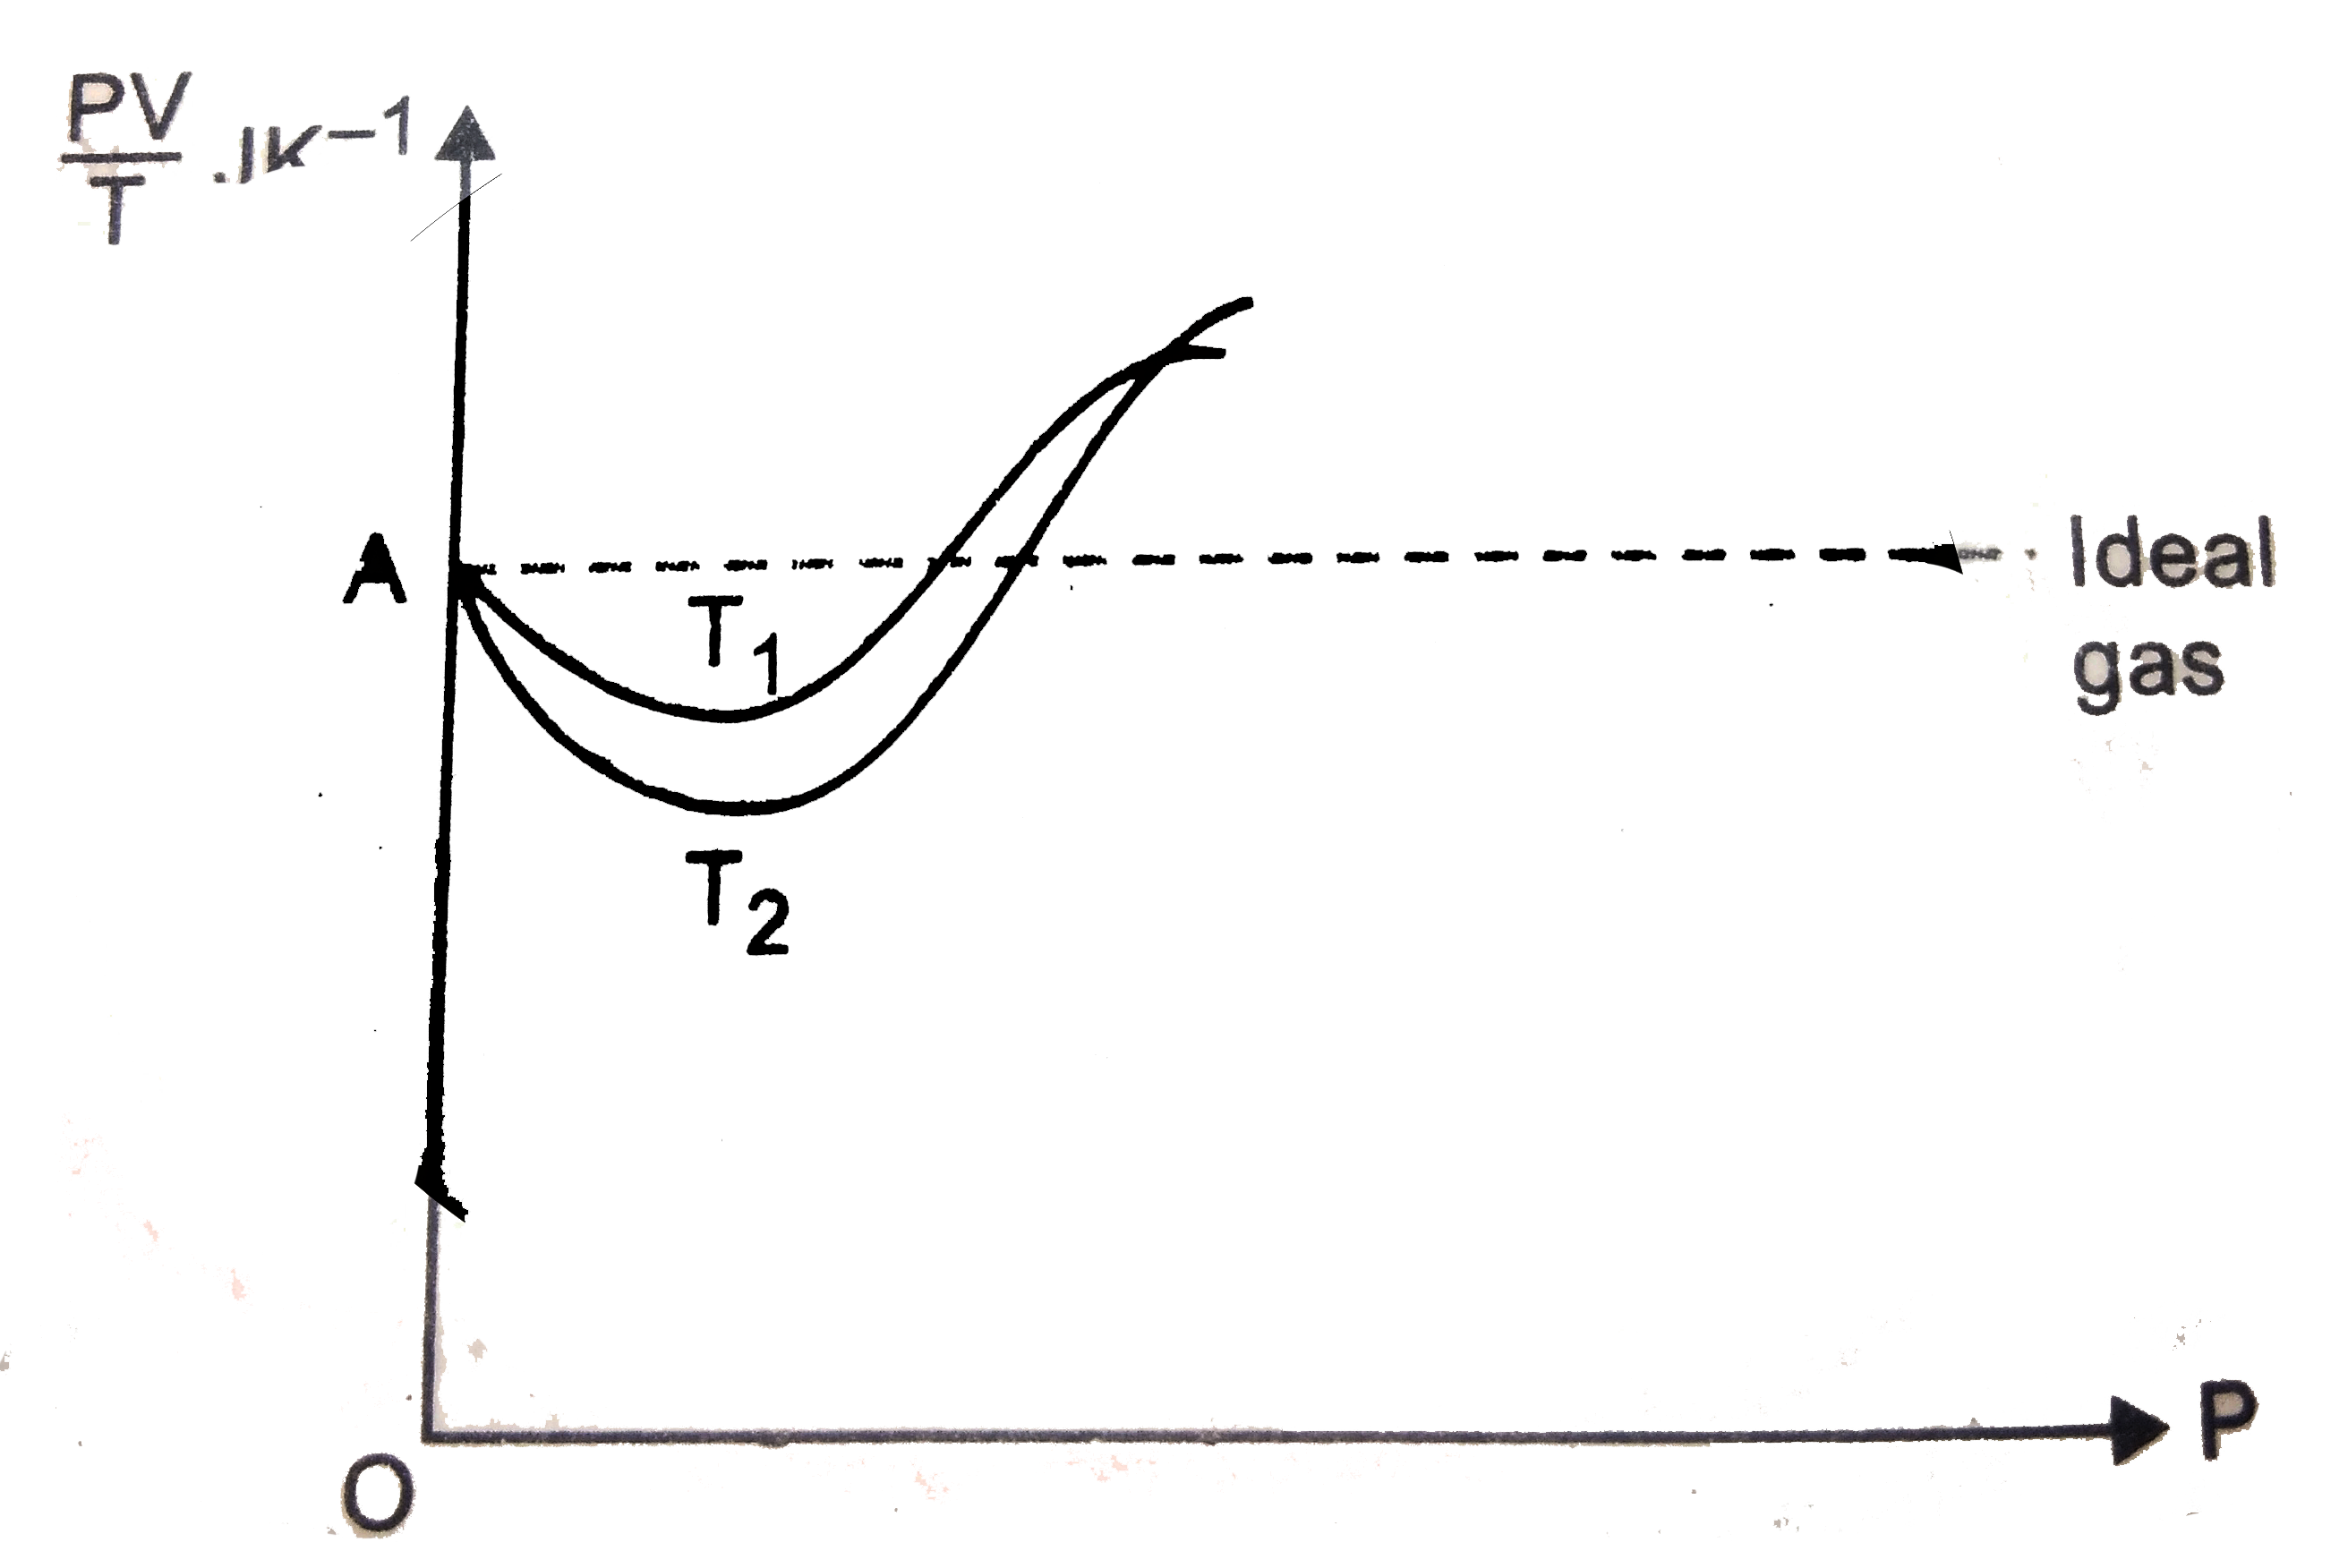
- Given is the graph between (PV)/T and P for 1 gm of oxygen gas at two ...
Text Solution
|
- The pressure of an ideal gas varies according to the law P = P(0) - AV...
Text Solution
|
- How many degress of freedom have the gas molecules, if under standard ...
Text Solution
|
- The temperature of a gas consisting of rigid diatomic molecules is T =...
Text Solution
|
- In a crude model of a rotating diatomic molecule of chlorine (Cl2), th...
Text Solution
|
- Find the number of degrees of freedom of molecules in a gas whose mola...
Text Solution
|
- An ideal gas undergoes a process in which PV^(-a)= constant, where V i...
Text Solution
|
- N molecules each of mass m of gas A and 2 N molecules each of mass 2m ...
Text Solution
|