Home
Class 9
MATHS
The following table shows the daily pr...

The following table shows the daily production of T.V. sets in an industry for 7 days of a week:

Represent the above information by a pictograph

Text Solution

Verified by Experts

Promotional Banner

Topper's Solved these Questions

  • FACTORIZATION OF POLYNOMIAL

    RD SHARMA|Exercise All Questions|220 Videos
  • HERON'S FORMULA

    RD SHARMA|Exercise All Questions|102 Videos

Similar Questions

Explore conceptually related problems

The following table gives the frequencies of most commonly used letters a,e,I,o,r,t,u, from a page of a book Represent the information above by a bar graph.

The following table shows the percentage of buyers of four different brands of bathing soaps. Represent the above data by a pie chart.

The following table shows the daily supply of electricity to differenet places in a town. To show the information by a pie diagram, measures of central angles of sectors are to be decided. Complete the following activity to find the measures.

The following table shows the daily supply of electricity to different places in a town. To show the information by a pie diagram measure of central angles of sectors are to be decided. Complete the following activity to find the measures:

The following table shows the percentages of demands for different fruits registered with a fruit vendor. Show the information by a pie diagram.

The following table shows the percentages of demands for different fruits registered with a fruit vendor. Show the information by a pie diagram.

The following table shows the production of gasoline in U.S.A. for the years 1962 to 1976. Obtain trend values for the above data using 5-yearly moving averages.

The following table shows the marks obtained by Sumit in the annual examination. Draw a bar graph to show the above information.

The following table shows the number of fruits in a fruit shop.Represent the above data by a bar graph

The following table represents income of a Gram Panchayat from different sources in a particular year: Draw a bar graph to represent the above information

RD SHARMA-GRAPHICAL REPRESENTATION OF STATISTICAL DATA-All Questions
  1. Read the following bar graph shown in Figure and answer the followi...

    Text Solution

    |

  2. Read the following bar graph given in Figure and answer the followin...

    Text Solution

    |

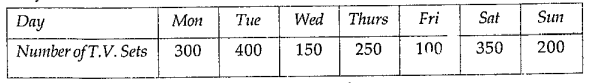
  3. The following table shows the daily production of T.V. sets in an in...

    Text Solution

    |

  4. The following table shows the number of Maruti cars sold by five d...

    Text Solution

    |

  5. The population of Delhi State in different census years is as given ...

    Text Solution

    |

  6. Study the bar graph representing the number of persons in various ag...

    Text Solution

    |

  7. Read the bar graph shown in Figure and answer the following question...

    Text Solution

    |

  8. Given below Figure in the bar graph indicating the marks obtained ou...

    Text Solution

    |

  9. Read the following bar graph (Figure) and answer the following quest...

    Text Solution

    |

  10. Read the following bar graph and answer the following questions: Wh...

    Text Solution

    |

  11. Read the following bar graph (Figure) and answer the following quest...

    Text Solution

    |

  12. Read the bar graph given in Figure and answer the following question...

    Text Solution

    |

  13. Read the bar graph given in Figure and answer the following question...

    Text Solution

    |

  14. Read the bar graph given in Figure and answer the following question...

    Text Solution

    |

  15. Read the bar graph given in Figure and answer the following question...

    Text Solution

    |

  16. The following data gives the number of students of Delhi state who w...

    Text Solution

    |

  17. In a school, there are five sections of class IX. The number of stud...

    Text Solution

    |

  18. The population of four major cities in India in a particular year is...

    Text Solution

    |

  19. The results of pass percentage of Class X and XII in C.B.S.E. examin...

    Text Solution

    |

  20. Read the following bar graph and answer the following questions: Wha...

    Text Solution

    |