Text Solution
Verified by Experts


Topper's Solved these Questions
Similar Questions
Explore conceptually related problems
RD SHARMA-GRAPHICAL REPRESENTATION OF STATISTICAL DATA-All Questions
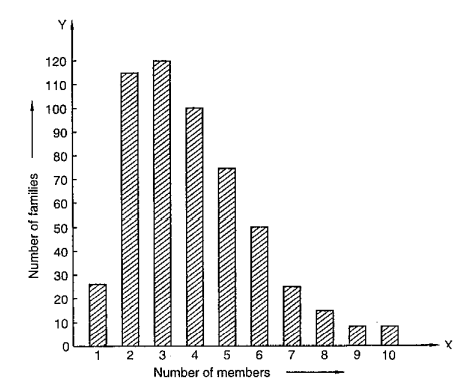
- Read the bar graph given in Figure and answer the following question...
Text Solution
|
- Read the bar graph given in Figure and answer the following question...
Text Solution
|
- Read the bar graph given in Figure and answer the following question...
Text Solution
|
- Read the bar graph given in Figure and answer the following question...
Text Solution
|
- The following data gives the number of students of Delhi state who w...
Text Solution
|
- In a school, there are five sections of class IX. The number of stud...
Text Solution
|
- The population of four major cities in India in a particular year is...
Text Solution
|
- The results of pass percentage of Class X and XII in C.B.S.E. examin...
Text Solution
|
- Read the following bar graph and answer the following questions: Wha...
Text Solution
|
- The following bar graph shows the results of an annual examination i...
Text Solution
|
- The production of saleable steel in some of the steel plants of our...
Text Solution
|
- The following table gives the route length (in thousand kilometres)...
Text Solution
|
- The following data gives the amount of loans (in crores of rupees) ...
Text Solution
|
- The following table sows the interest paid by a company (in lakh...
Text Solution
|
- The following data shows the average age of men in various countrie...
Text Solution
|
- The following data gives the production of foodgrains (in thousand...
Text Solution
|
- The following data gives the demand estimates of the Government of I...
Text Solution
|
- The investment (in ten crores of rupees) of the Life Insurance Corpo...
Text Solution
|
- The following data gives the value (in crores of rupees) of the In...
Text Solution
|
- The production of oil (in lakh tonnes) in some of the refineries ...
Text Solution
|