Home
Class 9
MATHS
The following bar graph shows the resu...

The following bar graph shows the results of an annual examination in a secondary school. Read the bar graph (Figure) and choose the correct alternative in each of the following:
The pair of classes in which the results of boys and girls are inversely proportional are:
(a) VI, VIII       (b) VI, IX      (c)  VIII, IX   (d)  VIII, X
The class having the lowest failure rate of girls is
VII     (b)  X         (c)  IX          (d)  VIII
The class having the lowest pass rate of students is
VI             (b)  VII       (c)  VIII         (d)  IX

Text Solution

Verified by Experts

(i)The pair of classes in which the results of boys and girls are inversely proportional are VI and IX. So, (b) is the correct option.
(ii)Lowest failure rate of girls is same to the highest pass rate. Hence, the class having the lowest failure rate of girls is VII. So, the correct option is (a)
(iii)The sum of the heights of the bars for boys and girls in the class VII is minimum, which is 95 + 40 = 135. Hence, the class having the lowest pass rate is VII. Hence, the correct option is (b)
Promotional Banner

Topper's Solved these Questions

  • FACTORIZATION OF POLYNOMIAL

    RD SHARMA|Exercise All Questions|220 Videos
  • HERON'S FORMULA

    RD SHARMA|Exercise All Questions|102 Videos

Similar Questions

Explore conceptually related problems

The following bar graph shows the results of an annual examination in a secondary school. Read the bar graph (Figure) and choose the correct alternative in each of the following: The pair of classes in which the results of boys and girls are inversely proportional are: (a) VI, VIII (b) VI, IX (c) VIII, IX (d) VIII, X The class having the lowest pass rate of students is: VII (b) X (c) IX (d) VIII The class having the lowest pass rate of students is: VI (b) VII (c) VIII (d) IX

The following table shows the marks obtained by Sumit in the annual examination. Draw a bar graph to show the above information.

The following bar graph shows the number of students in a particular class of school. Then, answer the following questions. What is the number of students in the year 2003?

The following bar graph shows the number of students in a particular class of school. Then, answer the following questions. (i) What is the nuber of students in the year 2003 ?

The following bar graph shows the number of students in a particular class of school. Then, answer the following questions. What is the number of students in the year 2003?

The following bar graph shows the number of students in different classes of a school. How many more students are there in Class IX than in Class VIII ?

The following data shows the number of students born in different months of a particular year of class VI. Make the bar graph based on the given information.

The following bar graph shows the number of students in a particular class of school. Then, answer the following questions. Is the number of students in the year 2002 is twice that in the year 2000?

In the given bar graph what is the ratio of the total boys and girls in all schools

RD SHARMA-GRAPHICAL REPRESENTATION OF STATISTICAL DATA-All Questions
  1. The results of pass percentage of Class X and XII in C.B.S.E. examin...

    Text Solution

    |

  2. Read the following bar graph and answer the following questions: Wha...

    Text Solution

    |

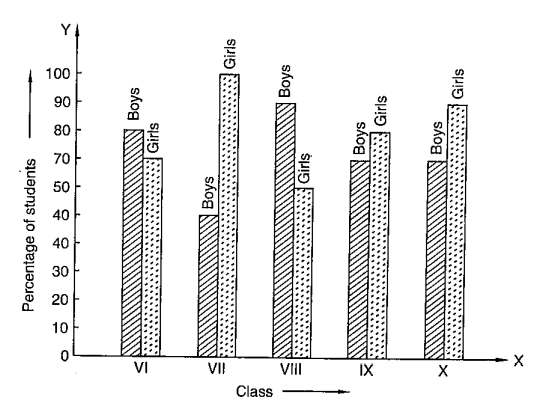
  3. The following bar graph shows the results of an annual examination i...

    Text Solution

    |

  4. The production of saleable steel in some of the steel plants of our...

    Text Solution

    |

  5. The following table gives the route length (in thousand kilometres)...

    Text Solution

    |

  6. The following data gives the amount of loans (in crores of rupees) ...

    Text Solution

    |

  7. The following table sows the interest paid by a company (in lakh...

    Text Solution

    |

  8. The following data shows the average age of men in various countrie...

    Text Solution

    |

  9. The following data gives the production of foodgrains (in thousand...

    Text Solution

    |

  10. The following data gives the demand estimates of the Government of I...

    Text Solution

    |

  11. The investment (in ten crores of rupees) of the Life Insurance Corpo...

    Text Solution

    |

  12. The following data gives the value (in crores of rupees) of the In...

    Text Solution

    |

  13. The production of oil (in lakh tonnes) in some of the refineries ...

    Text Solution

    |

  14. The expenditure (in 10 crores of rupees) on health by the Govern...

    Text Solution

    |

  15. The following table gives the marks scored by 100 students in an ent...

    Text Solution

    |

  16. The following is the distribution of weights (in kg) of 50 persons:...

    Text Solution

    |

  17. Represent the following data by means of historgram.

    Text Solution

    |

  18. Draw a histogram for the marks of students given below :

    Text Solution

    |

  19. The given table presents the number of illiterate males in the age gro...

    Text Solution

    |

  20. For the following data, draw a histogram and a frequency polygon:

    Text Solution

    |