A
B
C
D
Text Solution
Verified by Experts
The correct Answer is:


Topper's Solved these Questions
Similar Questions
Explore conceptually related problems
FIITJEE-TEST PAPERS-CHEMISTRY
- Galactose is epimeric with glucose at C(4). Which of the following str...
Text Solution
|
- Iodate ions can be reduced to iodine by iodide ions as per the given r...
Text Solution
|
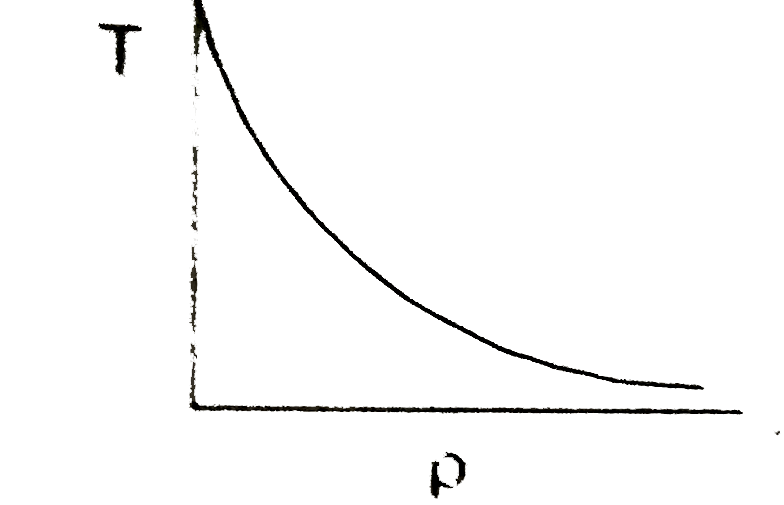
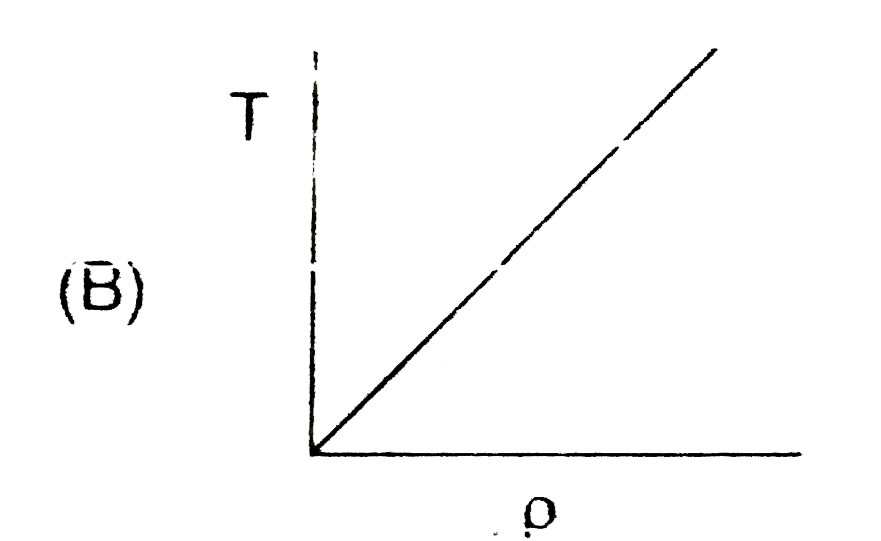
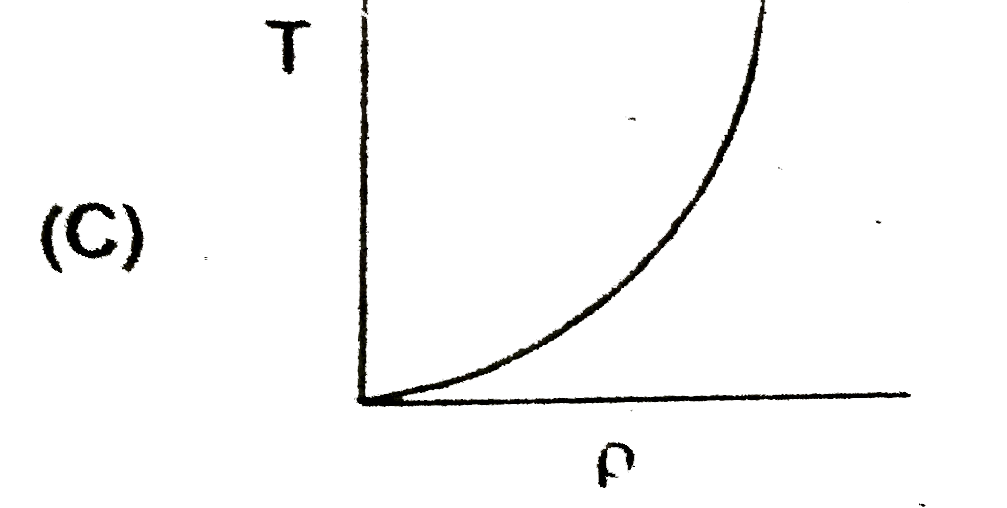
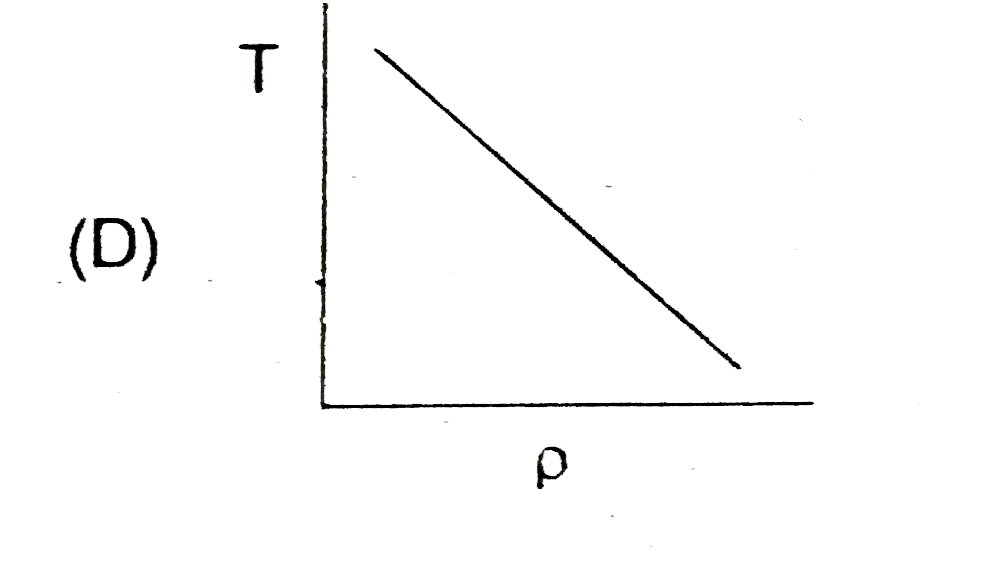
- Which of the following is a graph of the relation of the density (rho)...
Text Solution
|
- if mp and m(alpha) are masses of proton and alpha-particles find ratio...
Text Solution
|
- Consider the cell Ag|AgBr(s)Br^(-)||AgCl(s)Cl^(-)|Ag at 298 K the solu...
Text Solution
|
- Calculate the entropy change for vaporization of water if latent heat ...
Text Solution
|
- Which of the following plot of pressure (P) Vs time satisfy decomposit...
Text Solution
|
- A system works under cyclic process as follow Heat absorbed during t...
Text Solution
|
- Which of the following statement is correct about the cyclic silicate ...
Text Solution
|
- Ores of calcium are
Text Solution
|
- Find the incorrect statement.
Text Solution
|
- What is the decreasing order of stability
Text Solution
|
- find the incorrect order of acidic strength of following.
Text Solution
|
- product y is
Text Solution
|
- X is
Text Solution
|
- Product x is
Text Solution
|
- predict the product.
Text Solution
|
- The compounds x an y are
Text Solution
|
- what arx an y in the following reaction?
Text Solution
|
- An acid base indicator has K(a)=1.0xx10^(-5) the acid form of the indi...
Text Solution
|