A
B
C
D
Text Solution
Verified by Experts
The correct Answer is:


Similar Questions
Explore conceptually related problems
Recommended Questions
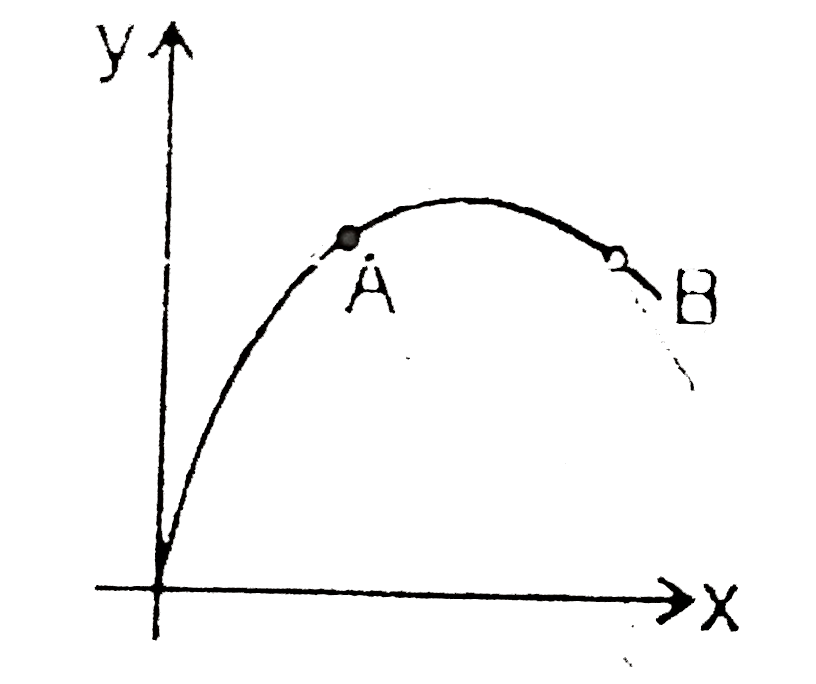
- For the shown graph slope of graph from point A to point B :
Text Solution
|
- For the shown graph slope of graph from point A to point B :
Text Solution
|
- The slope of graph as shown in figure at points 1,2 and 3 is m(1), m(2...
Text Solution
|
- Magnitude of slope of the shown graph.
Text Solution
|
- The slope of graph as shown in figure at points 1, 2 and 3 is m1, m2 a...
Text Solution
|
- The veloctiy - time graph of a body is shown in the fig. It implies th...
Text Solution
|
- Completion type Question : The slope of position-time graph at any poi...
Text Solution
|
- The slope of x-t graph at any point gives
Text Solution
|
- What does the slope of X-t graph at any point give ?
Text Solution
|