A
B
C
D
Text Solution
Verified by Experts
The correct Answer is:


Similar Questions
Explore conceptually related problems
Recommended Questions
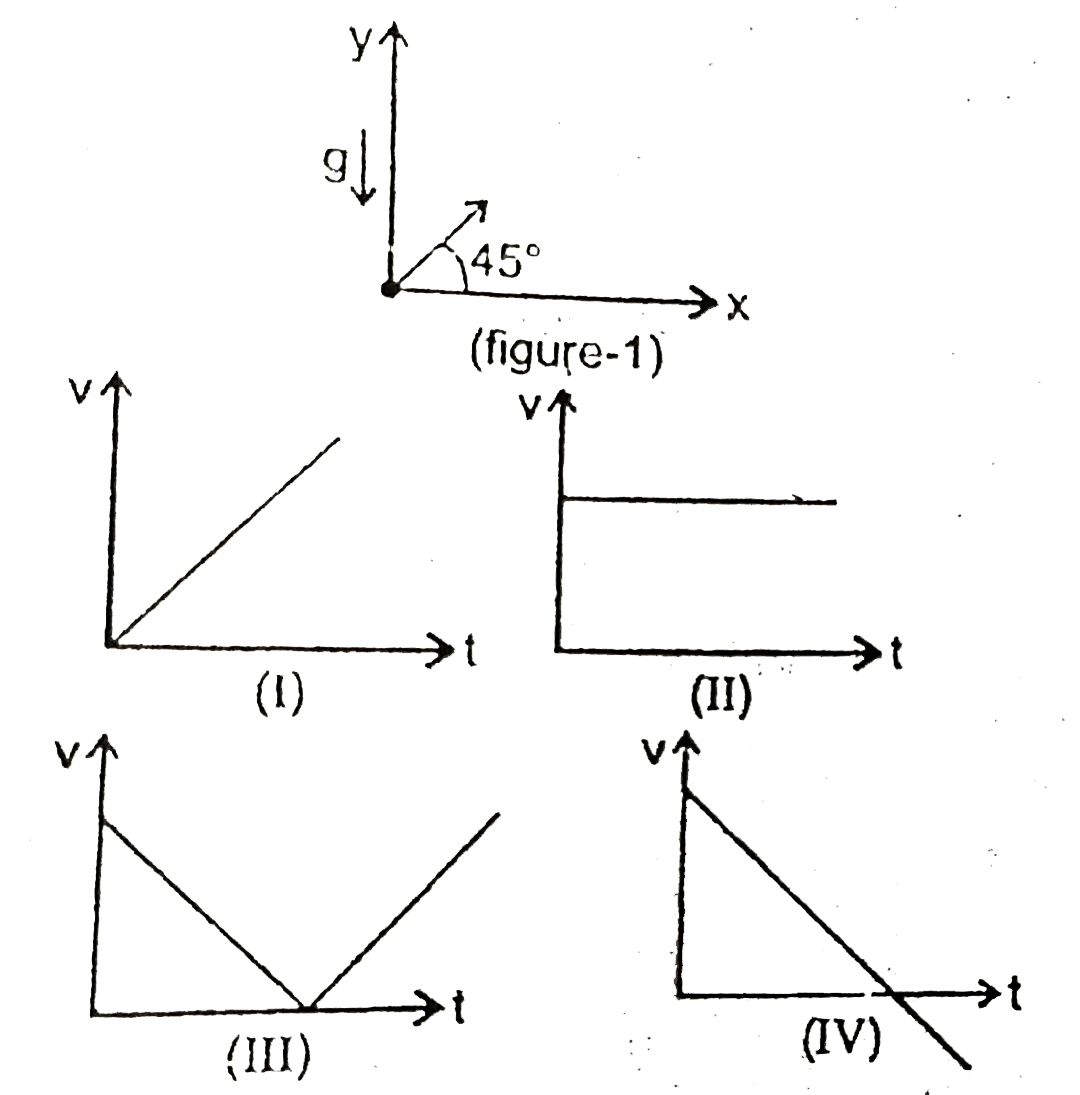
- A stone is projected at angle 45^(@) with the horizontal (x- axis) as ...
Text Solution
|
- A stone is projected at an angle 45^@ with horizontal above horizontal...
Text Solution
|
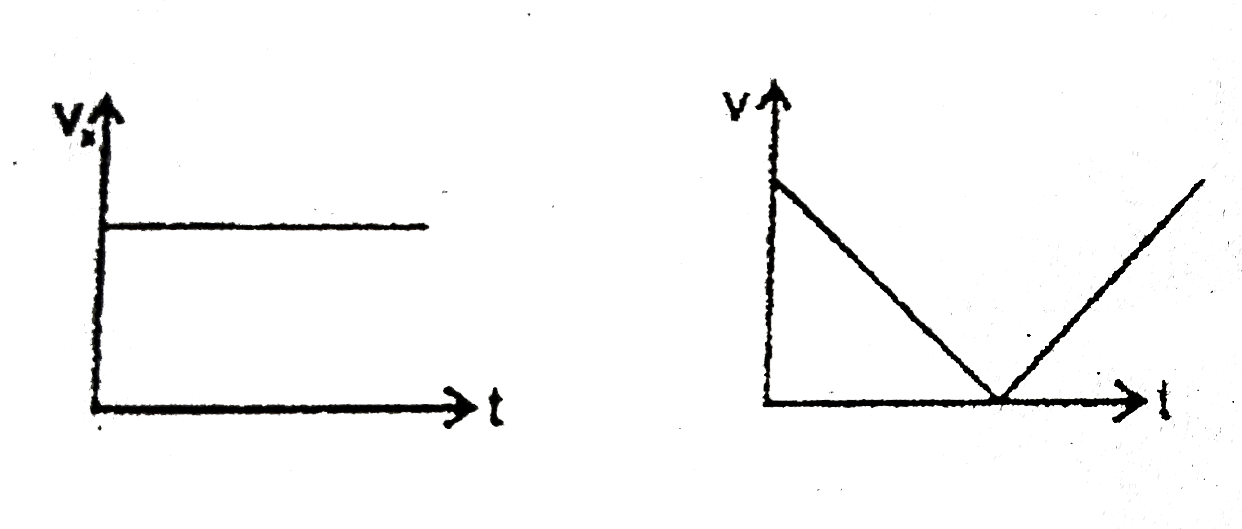
- In a projectile motion let v(x) and v(y) are the horizontal and vertic...
Text Solution
|
- A stone is projected at angle 45^(@) with the horizontal (x- axis) as ...
Text Solution
|
- A projectill is projected at an angle (alpha gt 45^(@)) with an initia...
Text Solution
|
- A projectile is thrown horizontally forma height 'h' a shown in the fi...
Text Solution
|
- A stone is thrown at 25m//s " at " 53^(@) above the horizontal. At wha...
Text Solution
|
- एक कण क्षैतिज से 45^(@) कोण पर P बिंदु से समय t=0 पर v(0) चाल से प्रक्...
Text Solution
|
- The magnitude of force acting on a particle moving along x-axis varies...
Text Solution
|