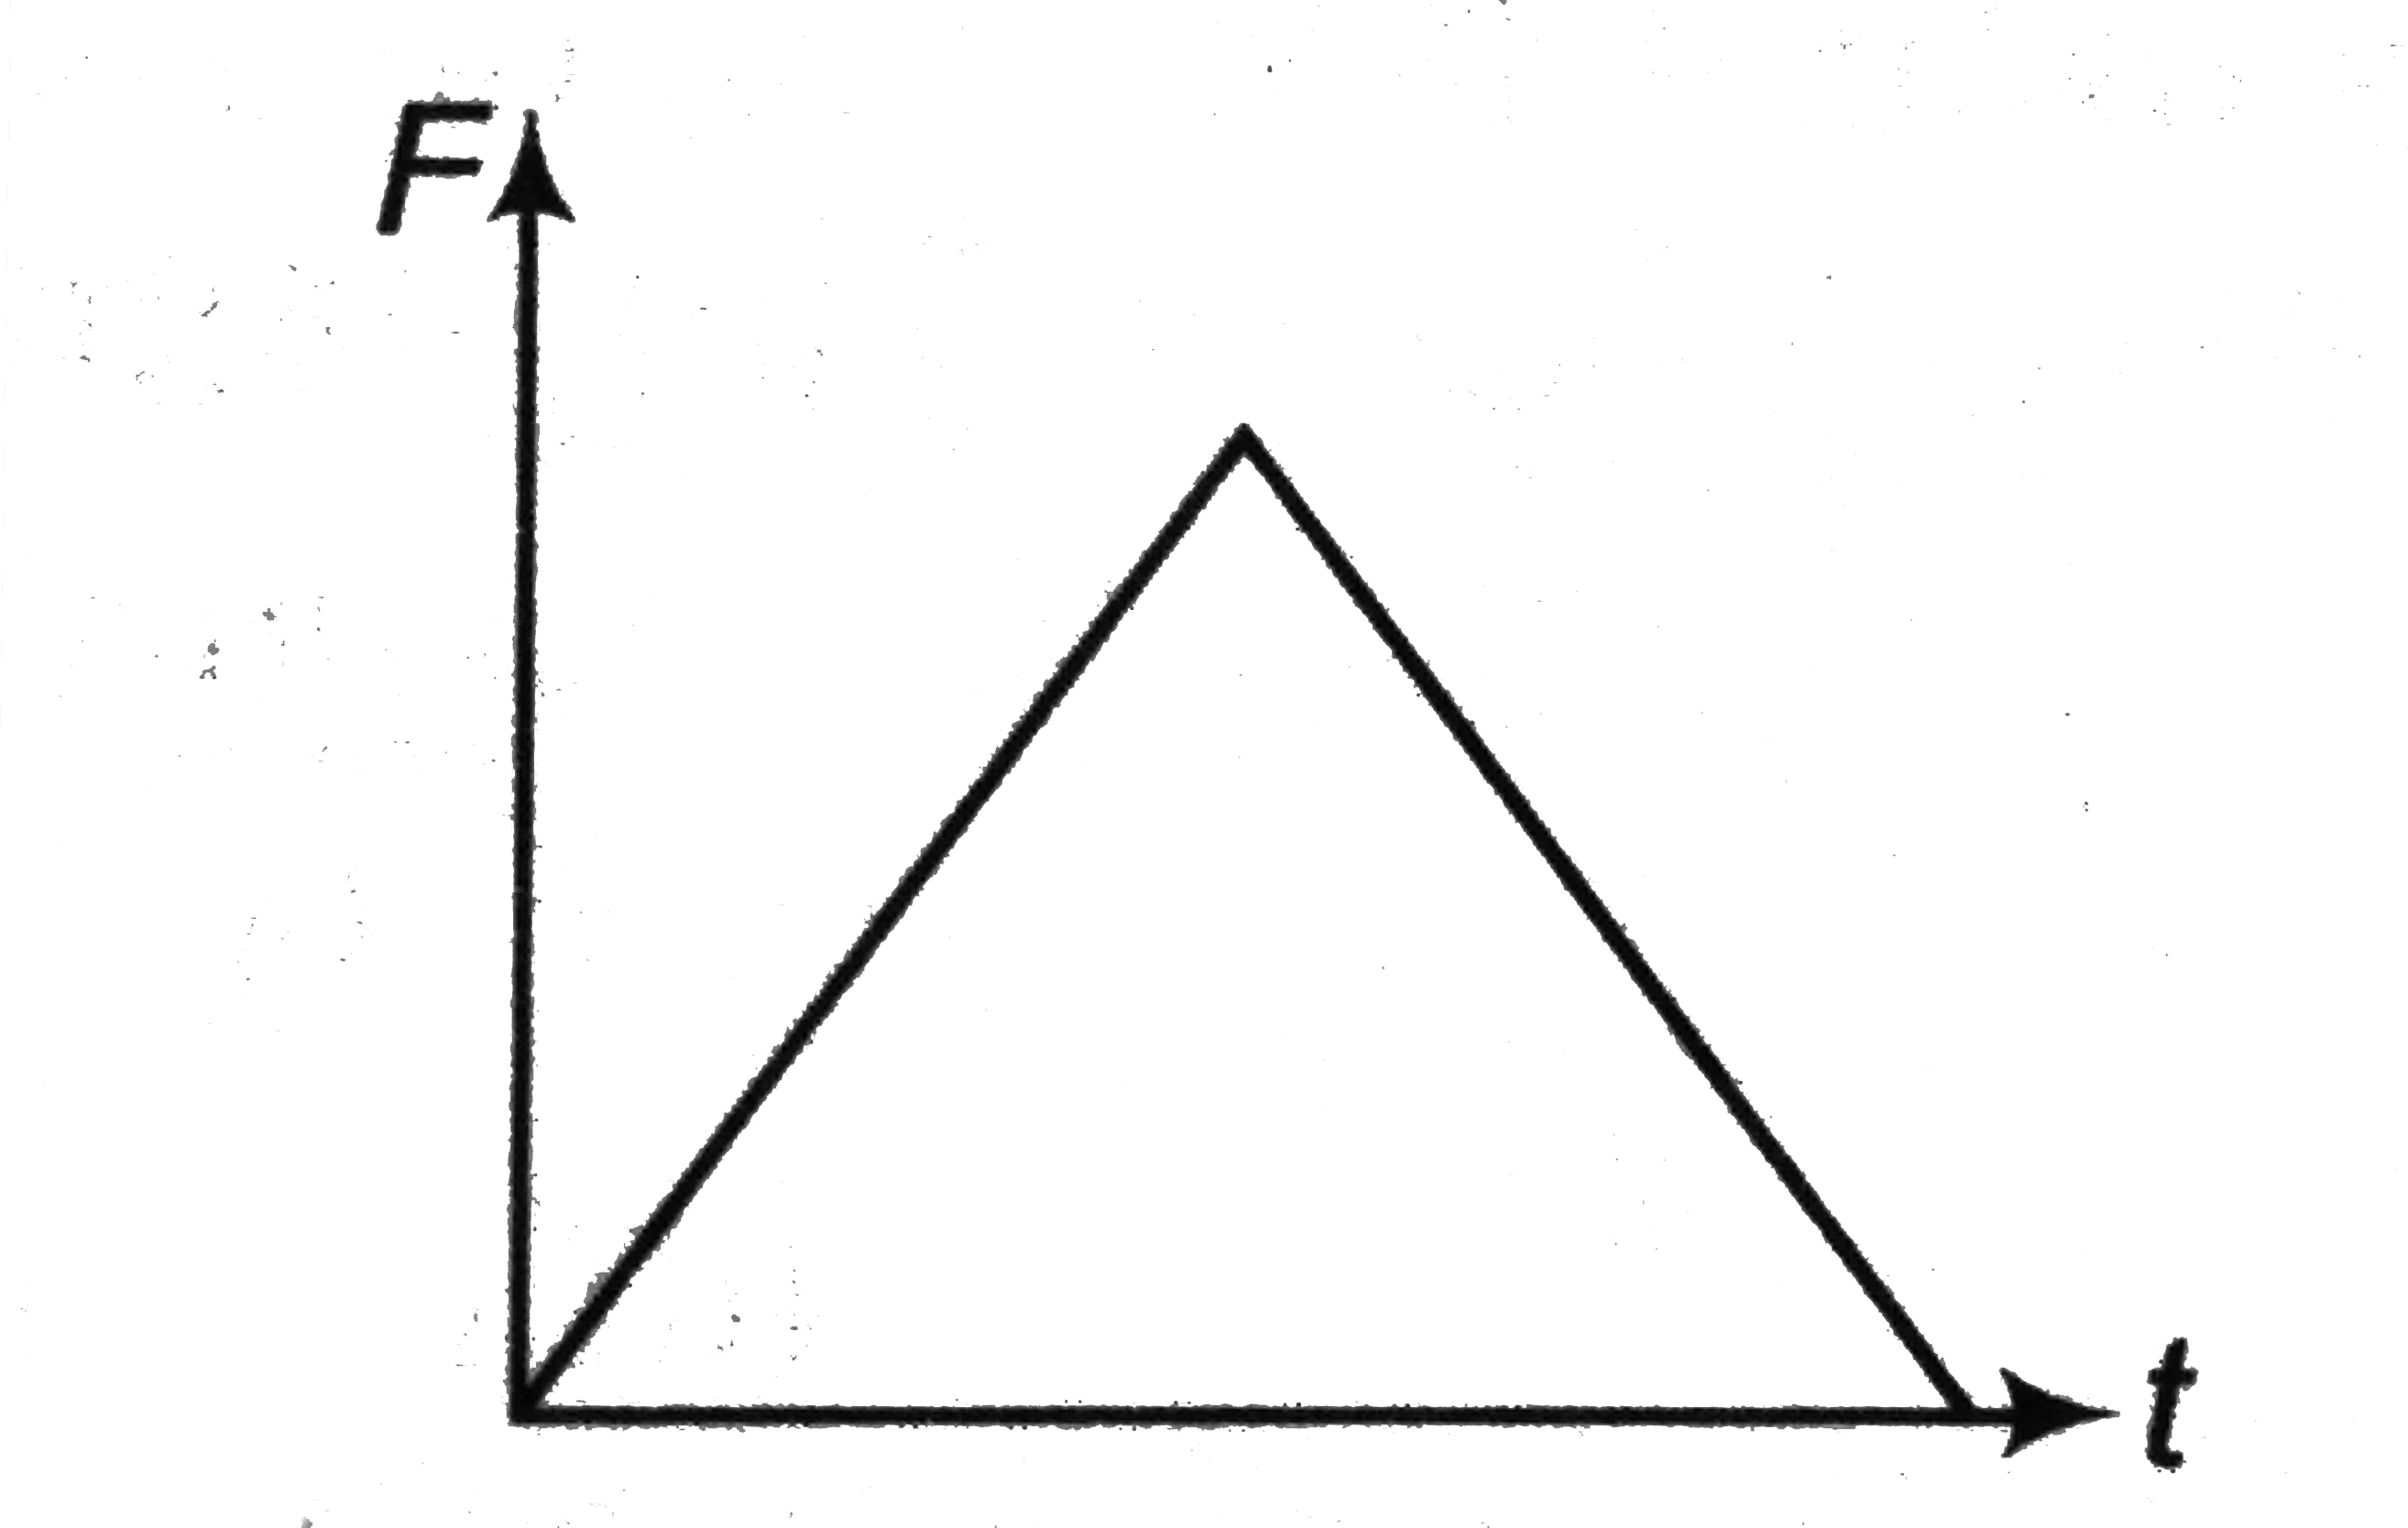
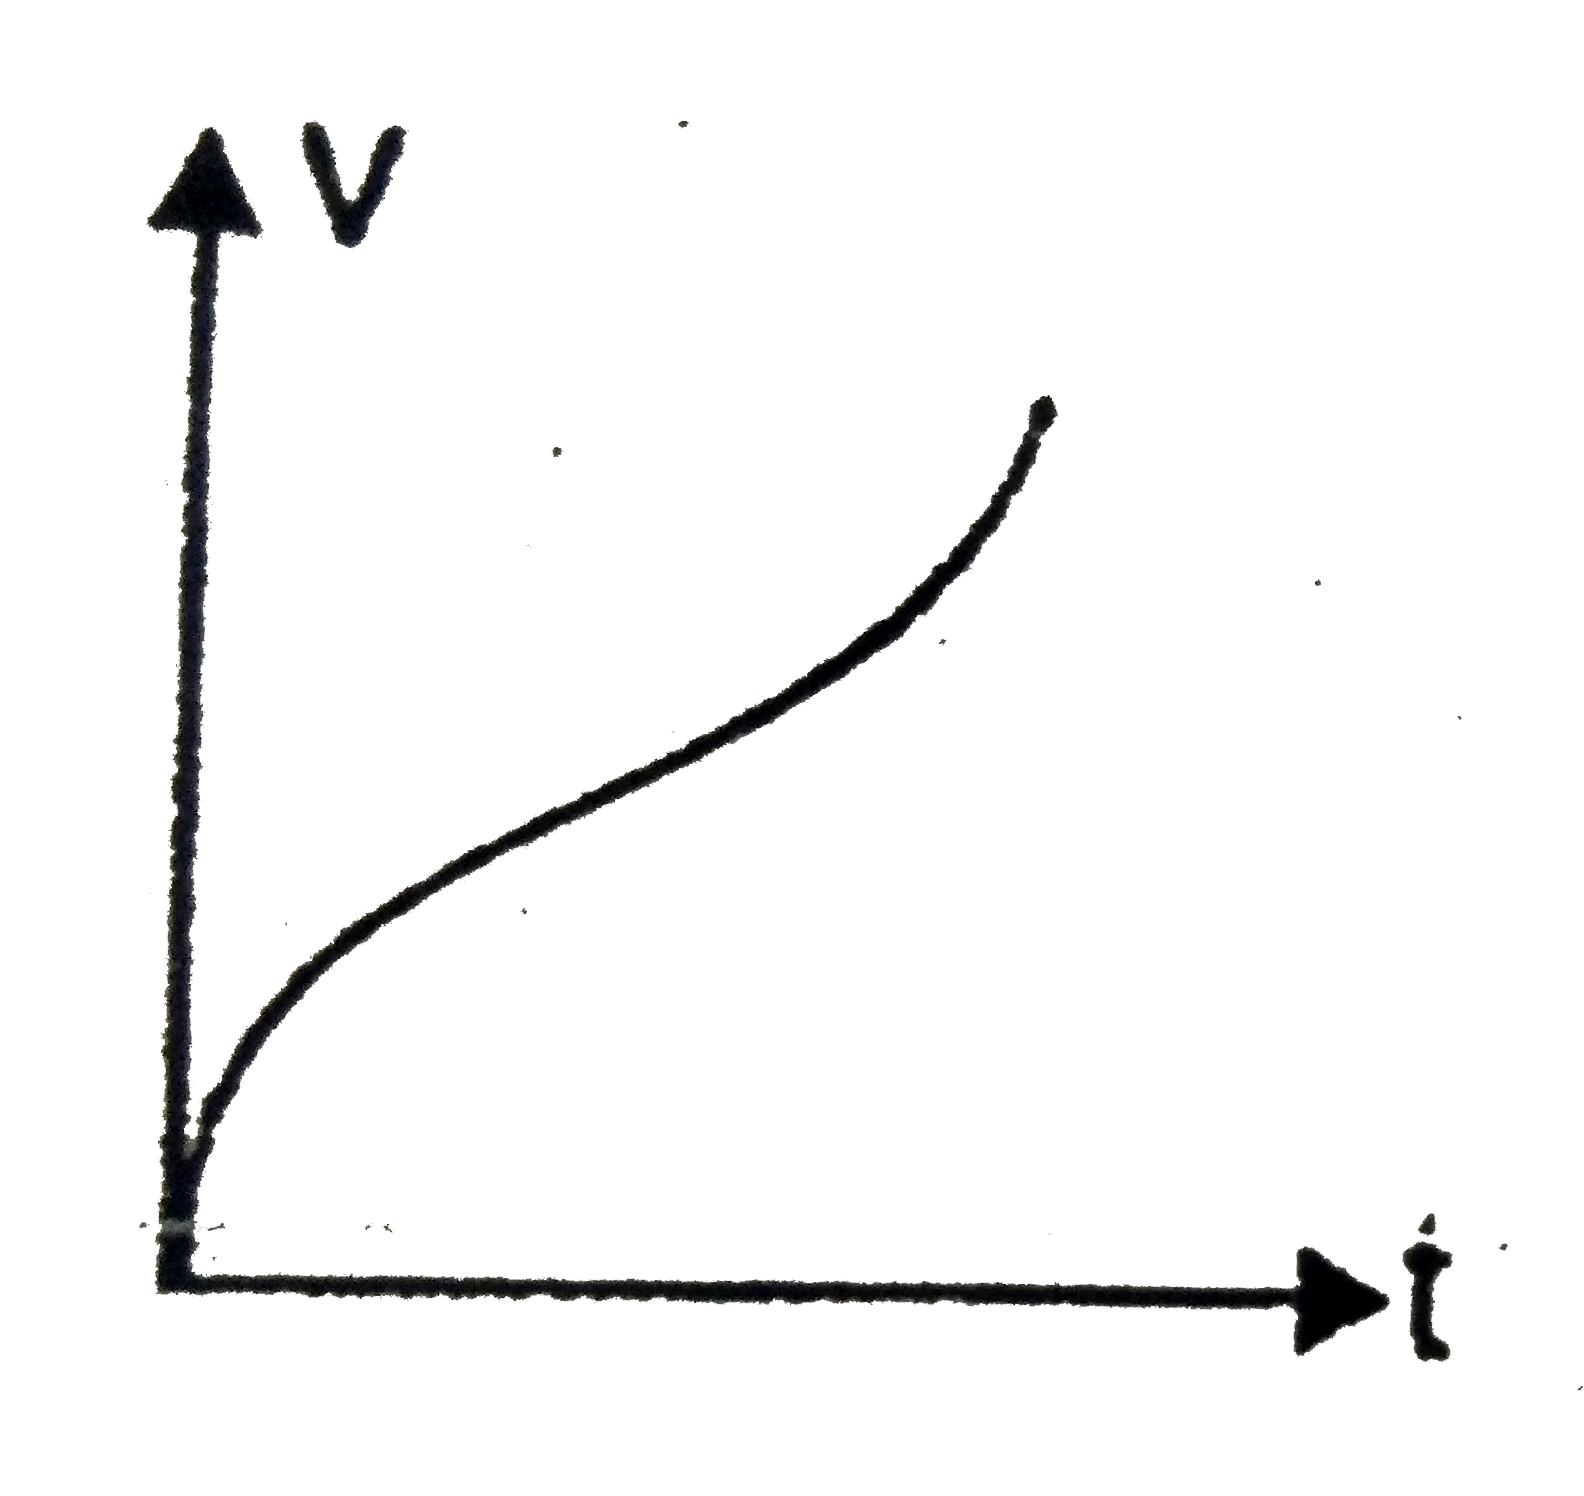
A
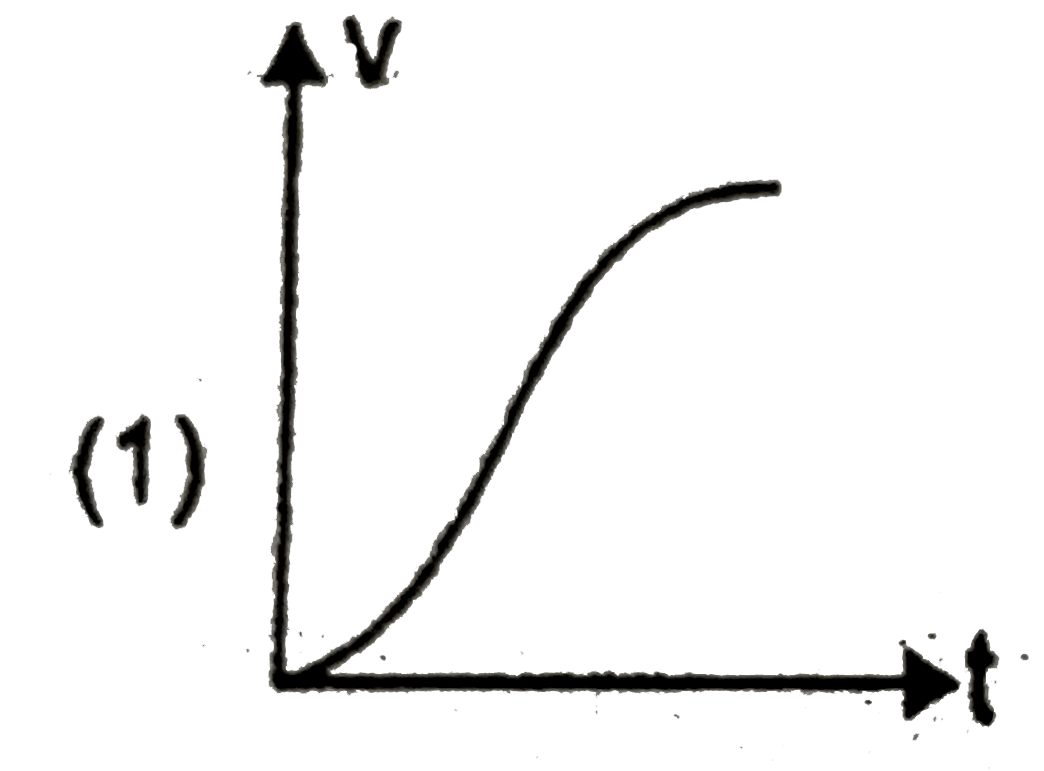
B
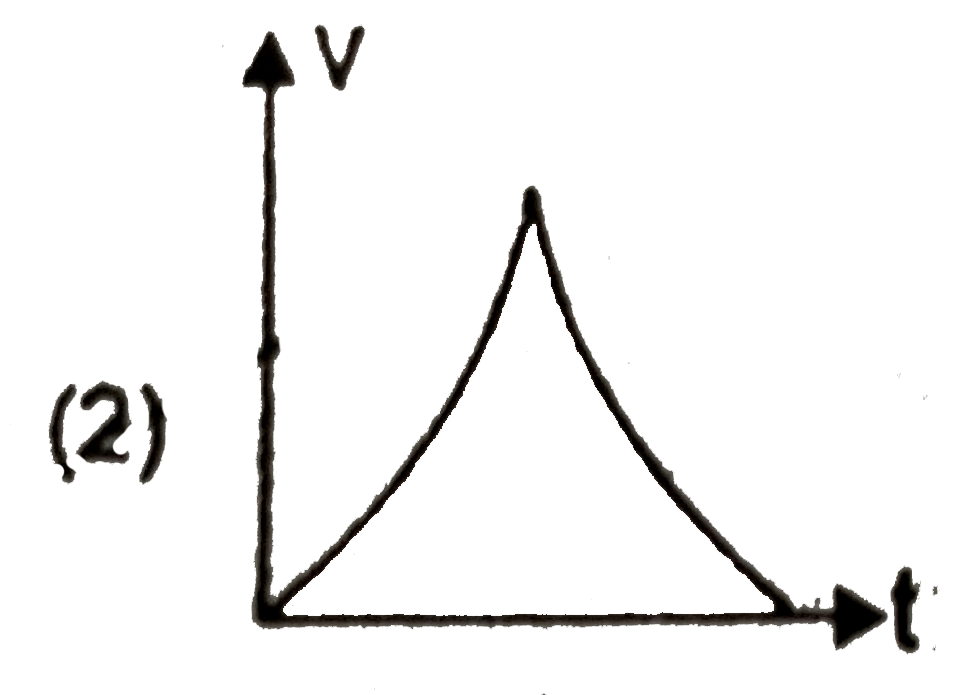
C
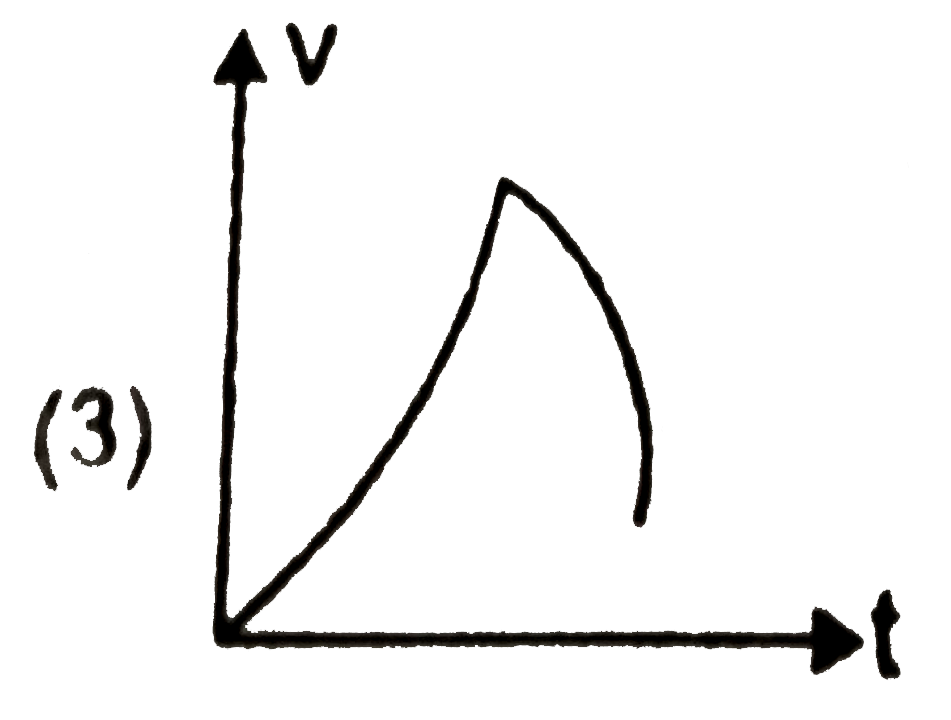
D
Text Solution
Verified by Experts
The correct Answer is:


Similar Questions
Explore conceptually related problems
Recommended Questions
- The net force acting on a particle moving along a straight line varies...
Text Solution
|
- The net force acting on a particle moving along a straight line varies...
Text Solution
|
- The acceleration-time graph of a particle moving along a straight line...
Text Solution
|
- Force acting on a particle of mass m moving in straight line varies wi...
Text Solution
|
- The force acting on a particle moving along a straight line varies wit...
Text Solution
|
- The graph of displacement vs time for a particle moving along a straig...
Text Solution
|
- The acceleration-time graph of a particle moving along a straight line...
Text Solution
|
- The acceleration time graph of a particle moving along a straight line...
Text Solution
|
- Force acting on a particle of mass m moving in straight line varies wi...
Text Solution
|