


Similar Questions
Explore conceptually related problems
Recommended Questions
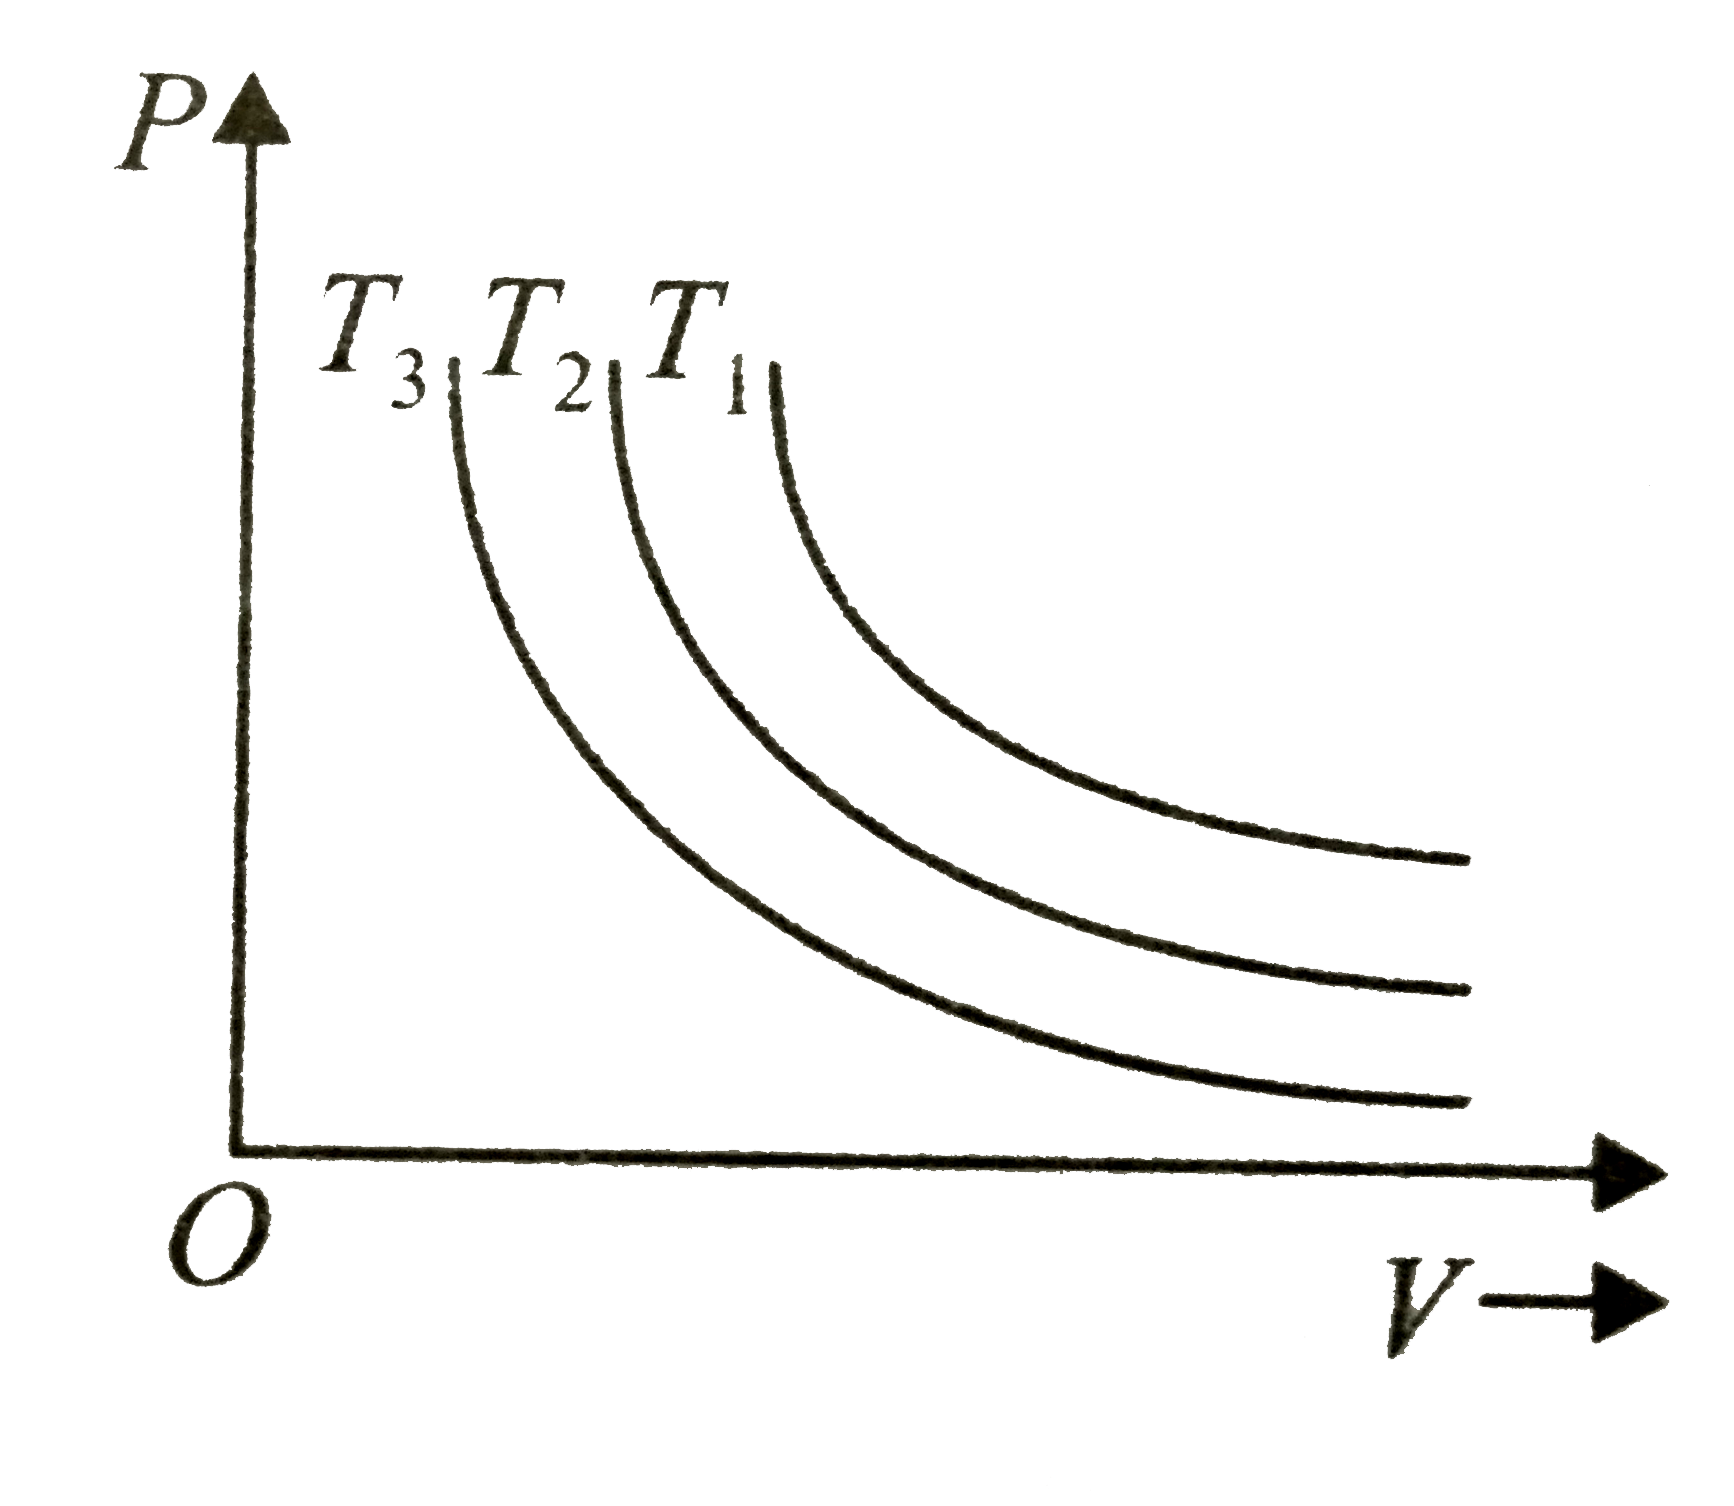
- The isothermal diagram of a gas at three different temperatures T(1),T...
Text Solution
|
- I,II,III are three isotherms respectively at T(1),T(2) and T(3) for a ...
Text Solution
|
- In following isothermal graphs A, B and C at temperatures T(1), T(2) a...
Text Solution
|
- The isothermal diagram of a gas at three different temperatures T(1),T...
Text Solution
|
- Figure shows the isotherms of fixed mass of an ideal gas at three temp...
Text Solution
|
- Two curves are given at temperatures T(1) and T(2) in an isothermal pr...
Text Solution
|
- The given figure shows the maxwell distribution of molecular speeds of...
Text Solution
|
- Isothermal curves for a given mass of gas are shown at two different t...
Text Solution
|
- The figure shows two isotherms at temperatures T(1) and T(2) . A gas i...
Text Solution
|