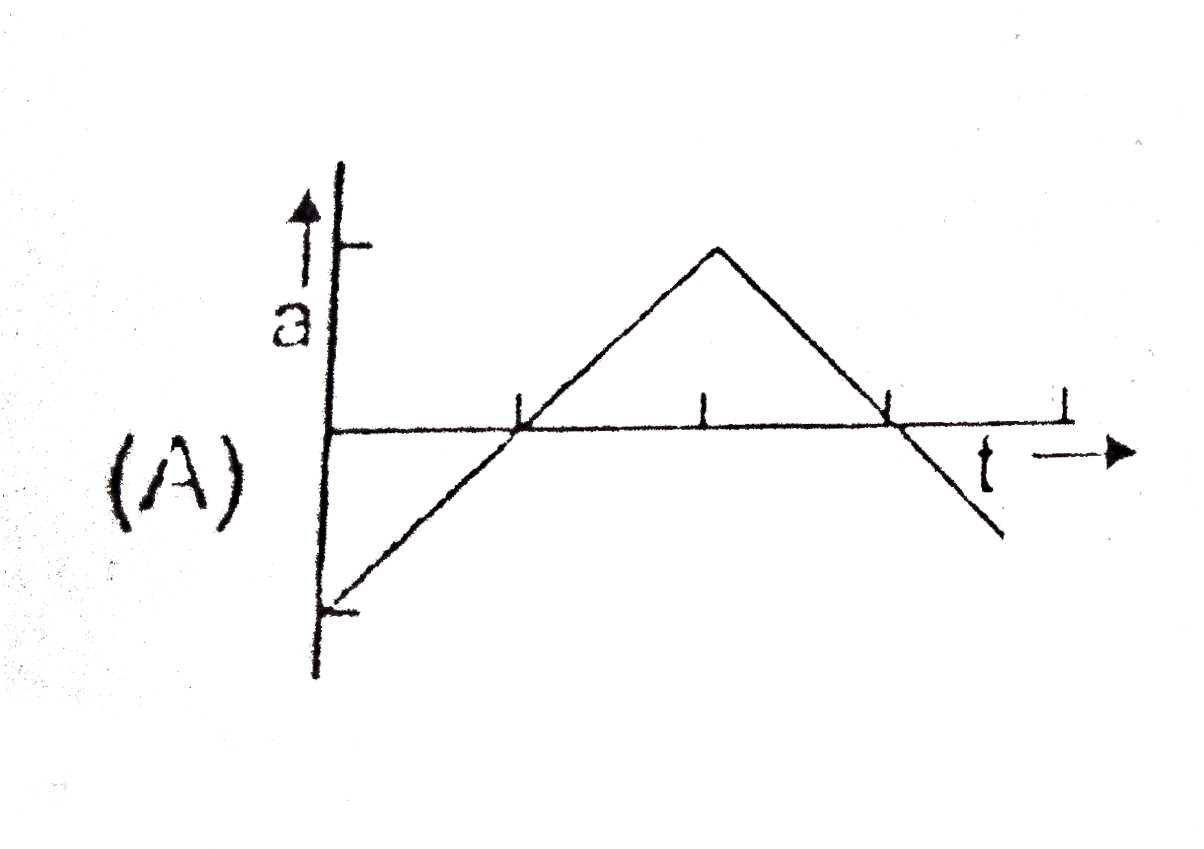
A
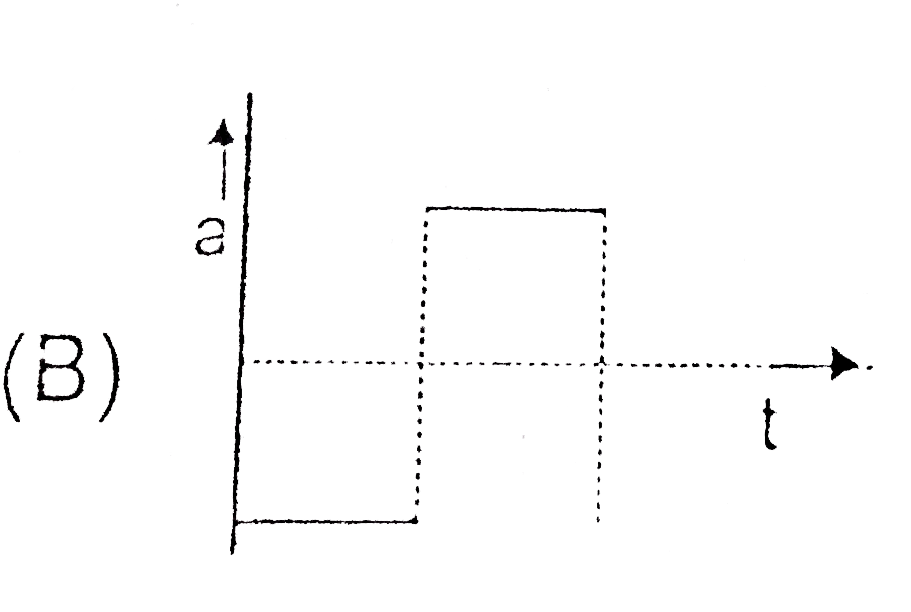
B
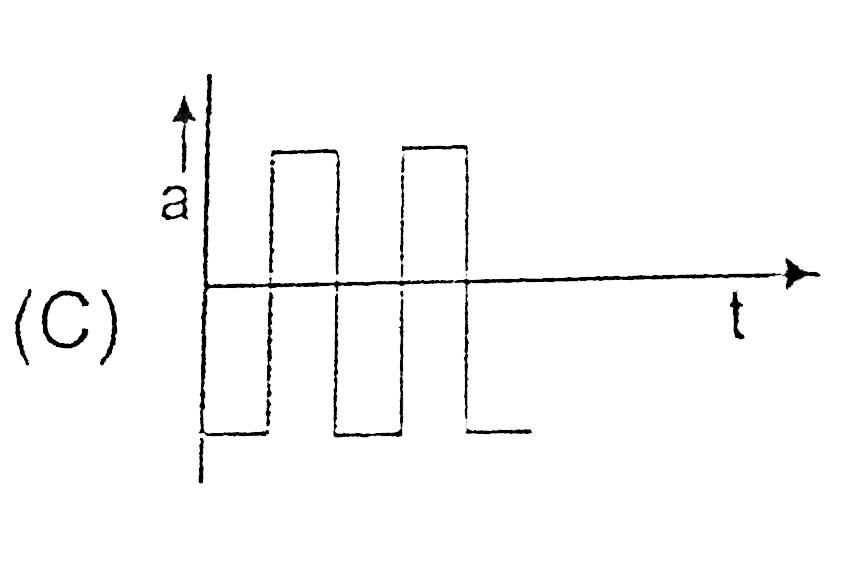
C
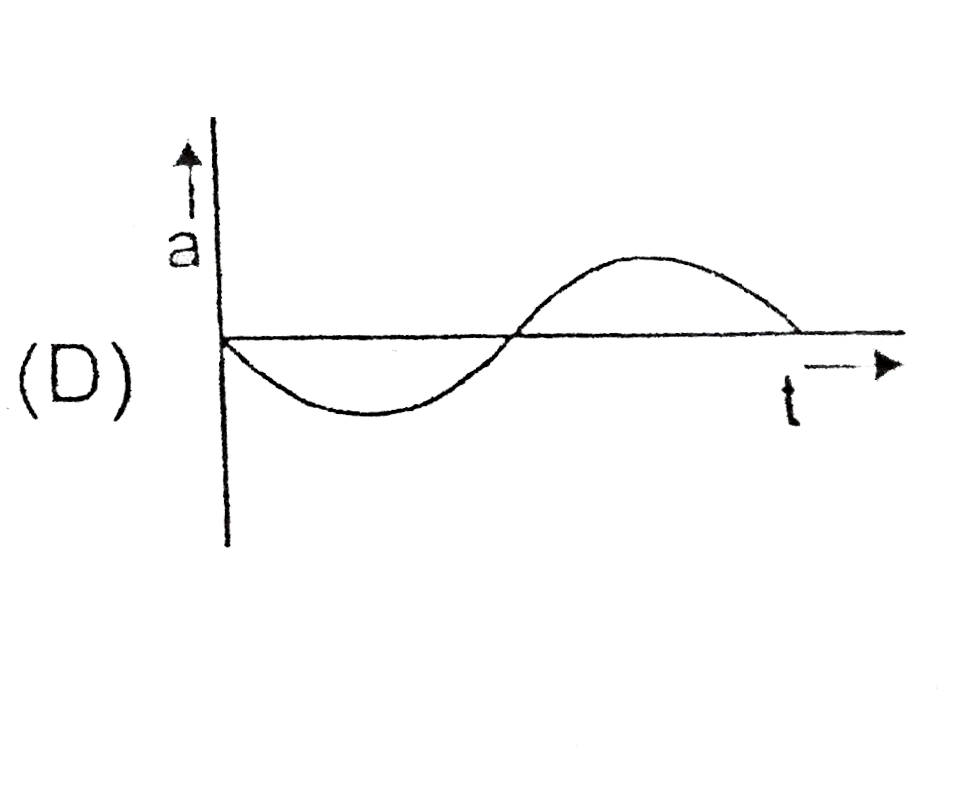
D
Text Solution
Verified by Experts
The correct Answer is:


Topper's Solved these Questions
DAILY PRACTICE PROBLEMS
RESONANCE|Exercise Dpp no. 13 physics|5 VideosDAILY PRACTICE PROBLEMS
RESONANCE|Exercise DPP NO. 14 PHYSICS|10 VideosDAILY PRACTICE PROBLEMS
RESONANCE|Exercise Compreshension|6 VideosCURRENT ELECTRICITY
RESONANCE|Exercise Exercise|54 VideosELASTICITY AND VISCOCITY
RESONANCE|Exercise Advanced Level Problems|9 Videos
Similar Questions
Explore conceptually related problems
RESONANCE-DAILY PRACTICE PROBLEMS-Dpp no 12 Physics
- A bird flies for 4 seconds with a velocity of |t-2|m//sec. In a straig...
Text Solution
|
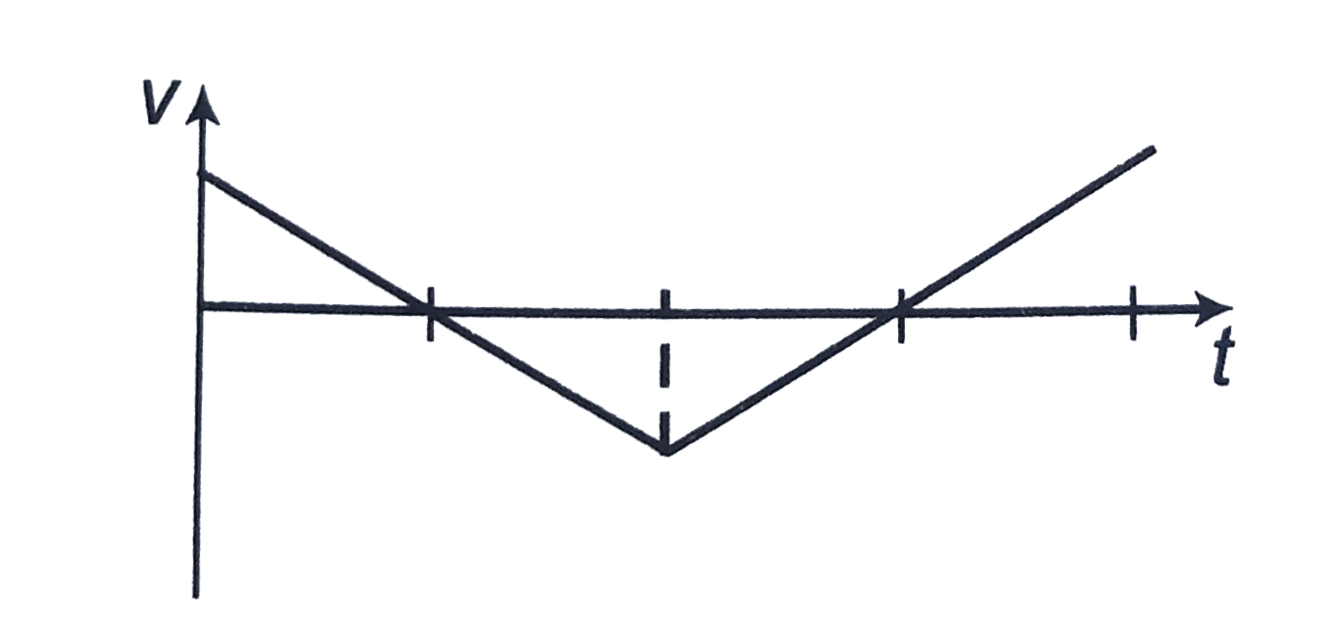
- The velocity - time graph of a particle is as shown in figure
Text Solution
|
- The graph below shws the velocity versus time graph for a body Wh...
Text Solution
|
- The position vector of a aprticle is given as vecr=(t^2-4t+6)hati+(t^2...
Text Solution
|
- A body starts from rest and moves with constant acceleration. The rati...
Text Solution
|
- An ant is at a corner of a cubical room of side a. The ant can move wi...
Text Solution
|
- A person starts from origin and for his linear motion velocity is give...
Text Solution
|
- Are the following velocity - time graph and speed - time graphs possib...
Text Solution
|