A
B
C
D
Text Solution
Verified by Experts
The correct Answer is:


Topper's Solved these Questions
Similar Questions
Explore conceptually related problems
RESONANCE-NEWTONS LAWS OF MOTION AND FRICTION-Exercise
- System shown in fig is in equilibrium and at rest. The spring and stri...
Text Solution
|
- Two particles of mass m each are tied at the ends of a light string of...
Text Solution
|
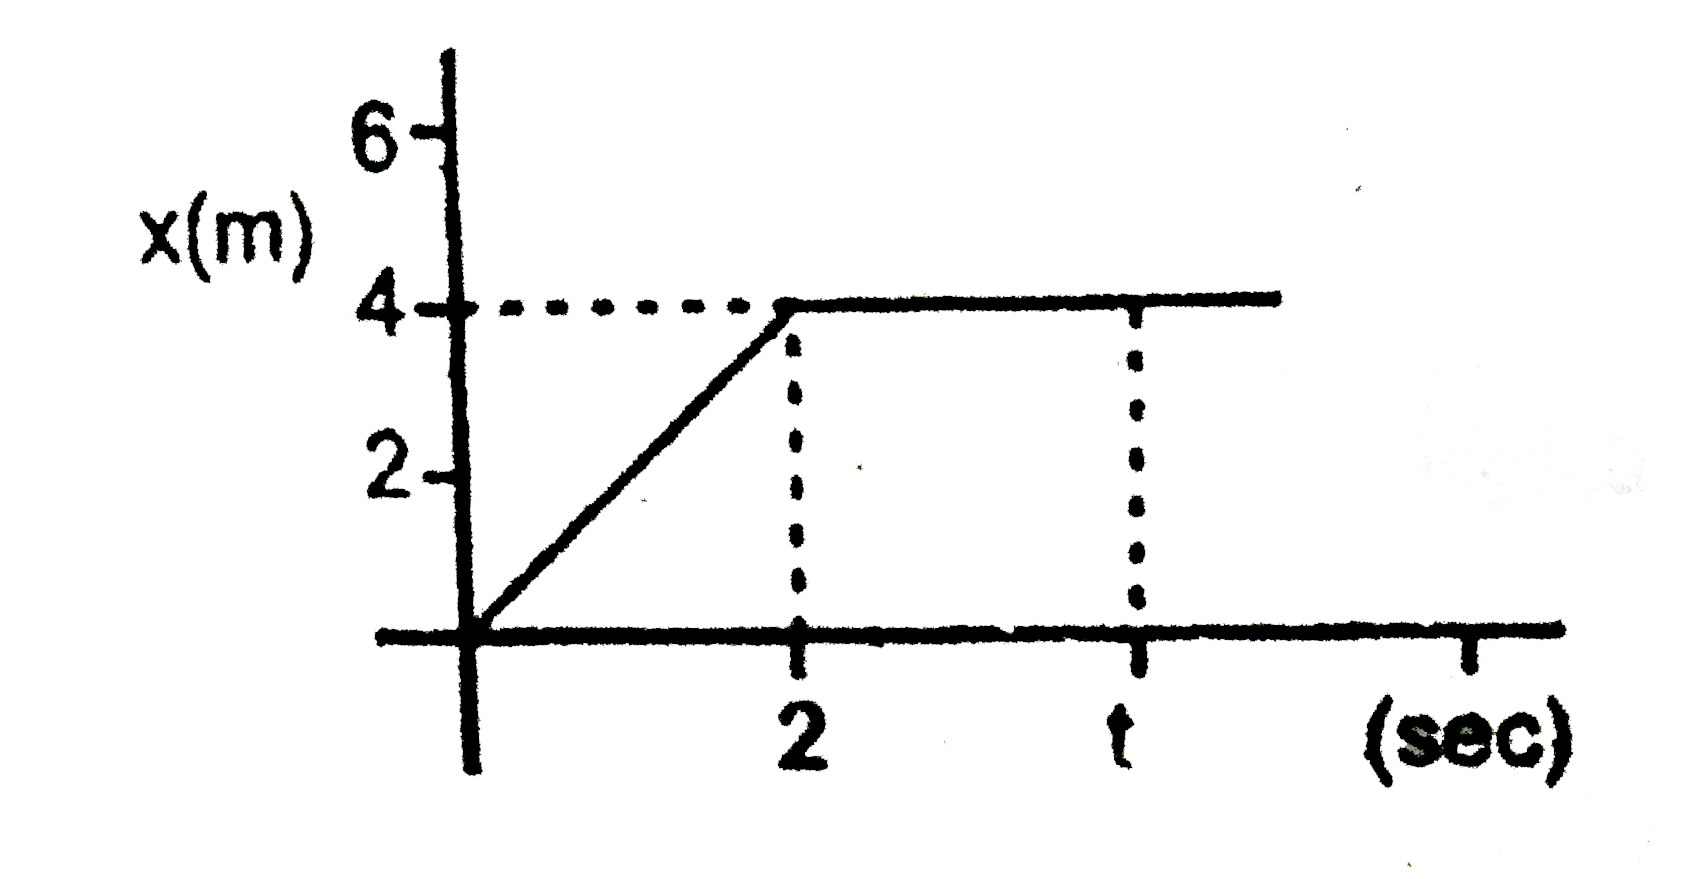
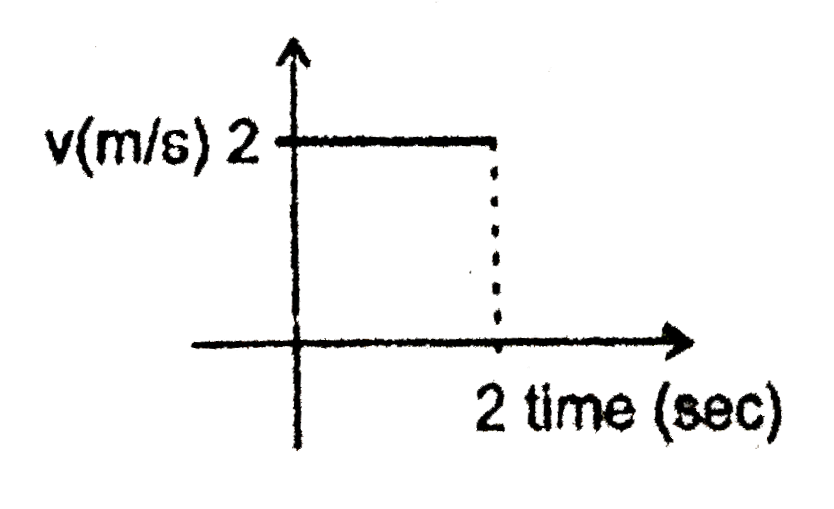
- In the figure given below, the position time graph of a particle of ma...
Text Solution
|
- A man is standing on a sparing platform, Reading of spring balaance is...
Text Solution
|
- Figure shows a 5 kg ladder hanging from a string that is connected wit...
Text Solution
|
- A body of mass 3kg hits a wall at an angle of 60^(@) and with speed of...
Text Solution
|
- A block of mass 4 kg is suspended through two light spring balances A ...
Text Solution
|
- Two masses m(1) and m(2) which are connected with a light string, are ...
Text Solution
|
- A wooden block and a metal coin are connected by a string as shown in ...
Text Solution
|
- Consider the system as shown in the figure. The pulley and the string ...
Text Solution
|
- The elevator shown in figure is descending, with an acceleration of 2 ...
Text Solution
|
- In the figure shown, a person wants to raise a block lying on the grou...
Text Solution
|
- Blocks of mass M(1) and M(2) are connected by a cord which passes over...
Text Solution
|
- A man of mass m stands on a platform of equal mass m and pulls himself...
Text Solution
|
- One end of massless rope, which passes over a massless and frictionles...
Text Solution
|
- The vertical displacement of a block A in meter is given by y=t^(2)//4...
Text Solution
|
- A metal sphere is a string fixed to a wall. The forces acting on the s...
Text Solution
|
- In the system shown in fig., m(A)=4m, m(B)=3m, and m(c)=8m. Friction i...
Text Solution
|
- A perfectly straight protion of a uniform rope has mass M and length L...
Text Solution
|
- Three blocks A,B and C of mass 10 kg each are hanging on a string pass...
Text Solution
|