Home
Class 12
BIOLOGY
The graph given below shows the variatio...

The graph given below shows the variations in the population of producers, primary consumers and secondary consumers as well as the amount of dissolved mineral salts in a pond

Which one of the following correctly matches each graph?

A

`{:("Producer population","Primary consumer population","Secondary consumer population"),(X,Y,W):}`

B

`{:("Producer population","Primary consumer population","Secondary consumer population"),(W,X,Y):}`

C

`{:("Producer population","Primary consumer population","Secondary consumer population"),(W,Y,X):}`

D

`{:("Producer population","Primary consumer population","Secondary consumer population"),(X,W,Y):}`

Text Solution

Verified by Experts

The correct Answer is:
C
Promotional Banner

Topper's Solved these Questions

  • BIOTECHNOLOGY AND ITS APPLICATION

    NCERT FINGERTIPS|Exercise Biotechnology And Its Application|137 Videos
  • ENVIRONMENTAL ISSUES

    NCERT FINGERTIPS|Exercise Environmental Issues|142 Videos

Similar Questions

Explore conceptually related problems

The graph of (y-x) against (y+x) is shown below. Which one of the following shows the graph of y against x ?

The position- time (x - t) graph for motion of a body is given below: Which one among the following is depicted by the above graph?

Which of the following graphs given below show (s) adiabatic process?

The line graph given below shows the production of a particular model of bike produced in different months. Read the line graph and answer the following questions: In which month is the production maximum?

The line graph given below shows the production of a particular model of bike produced in different months. Read the line graph and answer the following questions: In which month is the production least?

The line graph given below shows the production of a particular model of bike produced in different months. Read the line graph and answer the following questions: In which two successive months has the production increased?

The line graph given below shows the production of a particular model of bike produced in different months. Read the line graph and answer the following questions: In which two successive months has the production decreased?

The graph given show the position of two cars A and B as a function of time. The cars move along the x axis on parallel but separate tracks, so that they can pass each other's position without colliding. Which one of the following best describes the motion of car A as shown on the graphs?

NCERT FINGERTIPS-ECOSYSTEM-Ecosystem
  1. Succession in a forest ecosystem is characterised by chnages in specie...

    Text Solution

    |

  2. The given diagram represents the relationships between organisms in a ...

    Text Solution

    |

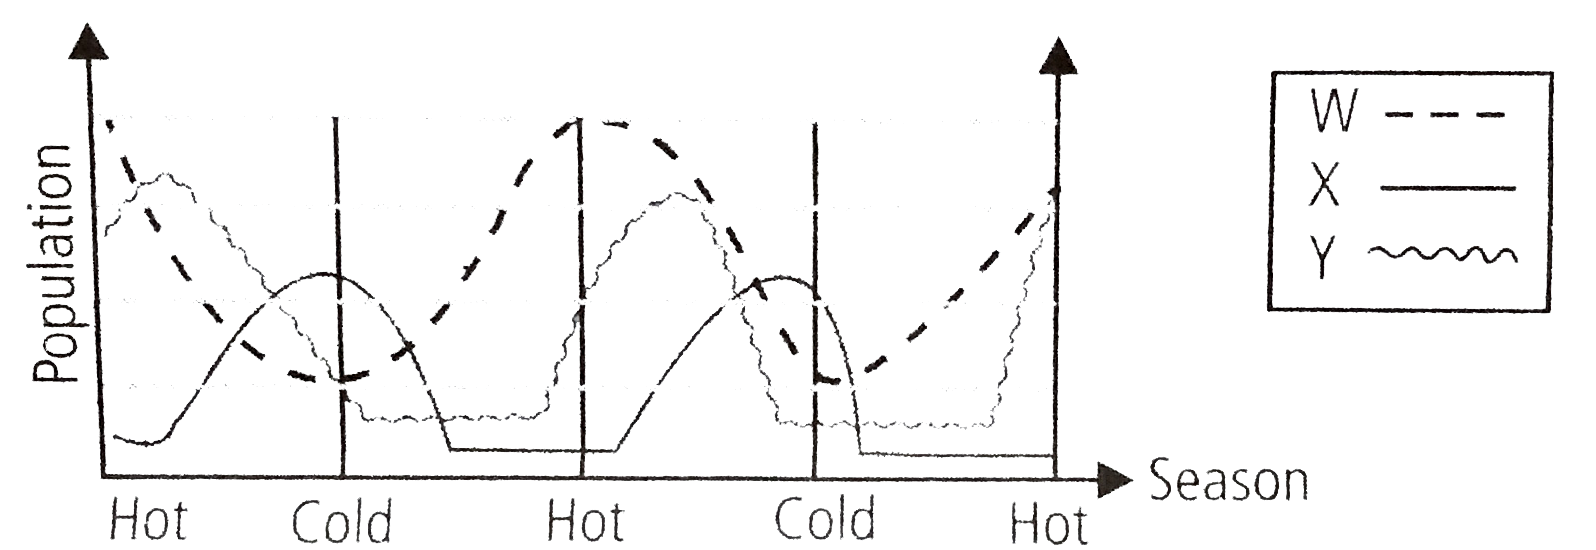
  3. The graph given below shows the variations in the population of produc...

    Text Solution

    |

  4. The given graphs shows the productivity of an aquatic ecosystem measur...

    Text Solution

    |

  5. Decomposers like fungi and bacteria are

    Text Solution

    |

  6. The process of mineralisation by microorganisms helps in the relase of

    Text Solution

    |

  7. Productivity is the rate of production of biomass expressed in terms o...

    Text Solution

    |

  8. An inverted pyramid of biomass can be found in which ecosystem?

    Text Solution

    |

  9. Which of the pyramid of biomass can be found in which ecosystem?

    Text Solution

    |

  10. Which of the following ecosystems is most productive in terms of net p...

    Text Solution

    |

  11. Pyramid of numbers is

    Text Solution

    |

  12. Approximately how much of the solar energy that falls on the leaves of...

    Text Solution

    |

  13. Among the following where do you think the process of decomposition wo...

    Text Solution

    |

  14. How much of the net primary productivity of a terrestrial ecosystem is...

    Text Solution

    |

  15. During the process of ecological succession, the changes that take pla...

    Text Solution

    |

  16. Climax community is in a state of

    Text Solution

    |

  17. Among the following biogeochemical cycles, which one does not have los...

    Text Solution

    |

  18. The sequence of communities of primary succession in water is

    Text Solution

    |

  19. The reservoir for the gaseous type of biogeochemical cycle exists in

    Text Solution

    |

  20. If the carbon atoms fixed by producers already have passed through thr...

    Text Solution

    |