


Similar Questions
Explore conceptually related problems
Recommended Questions
- 1 mole of an ideal gas in a cylindrical container have the P-V diagram...
Text Solution
|
- In the following P-V diagram two adiabatics cut two isothermals at tem...
Text Solution
|
- Consider a P-V diagram in which the path followed by one mole of perfe...
Text Solution
|
- n moles of an ideal gas is taken through a four step cyclic process as...
Text Solution
|
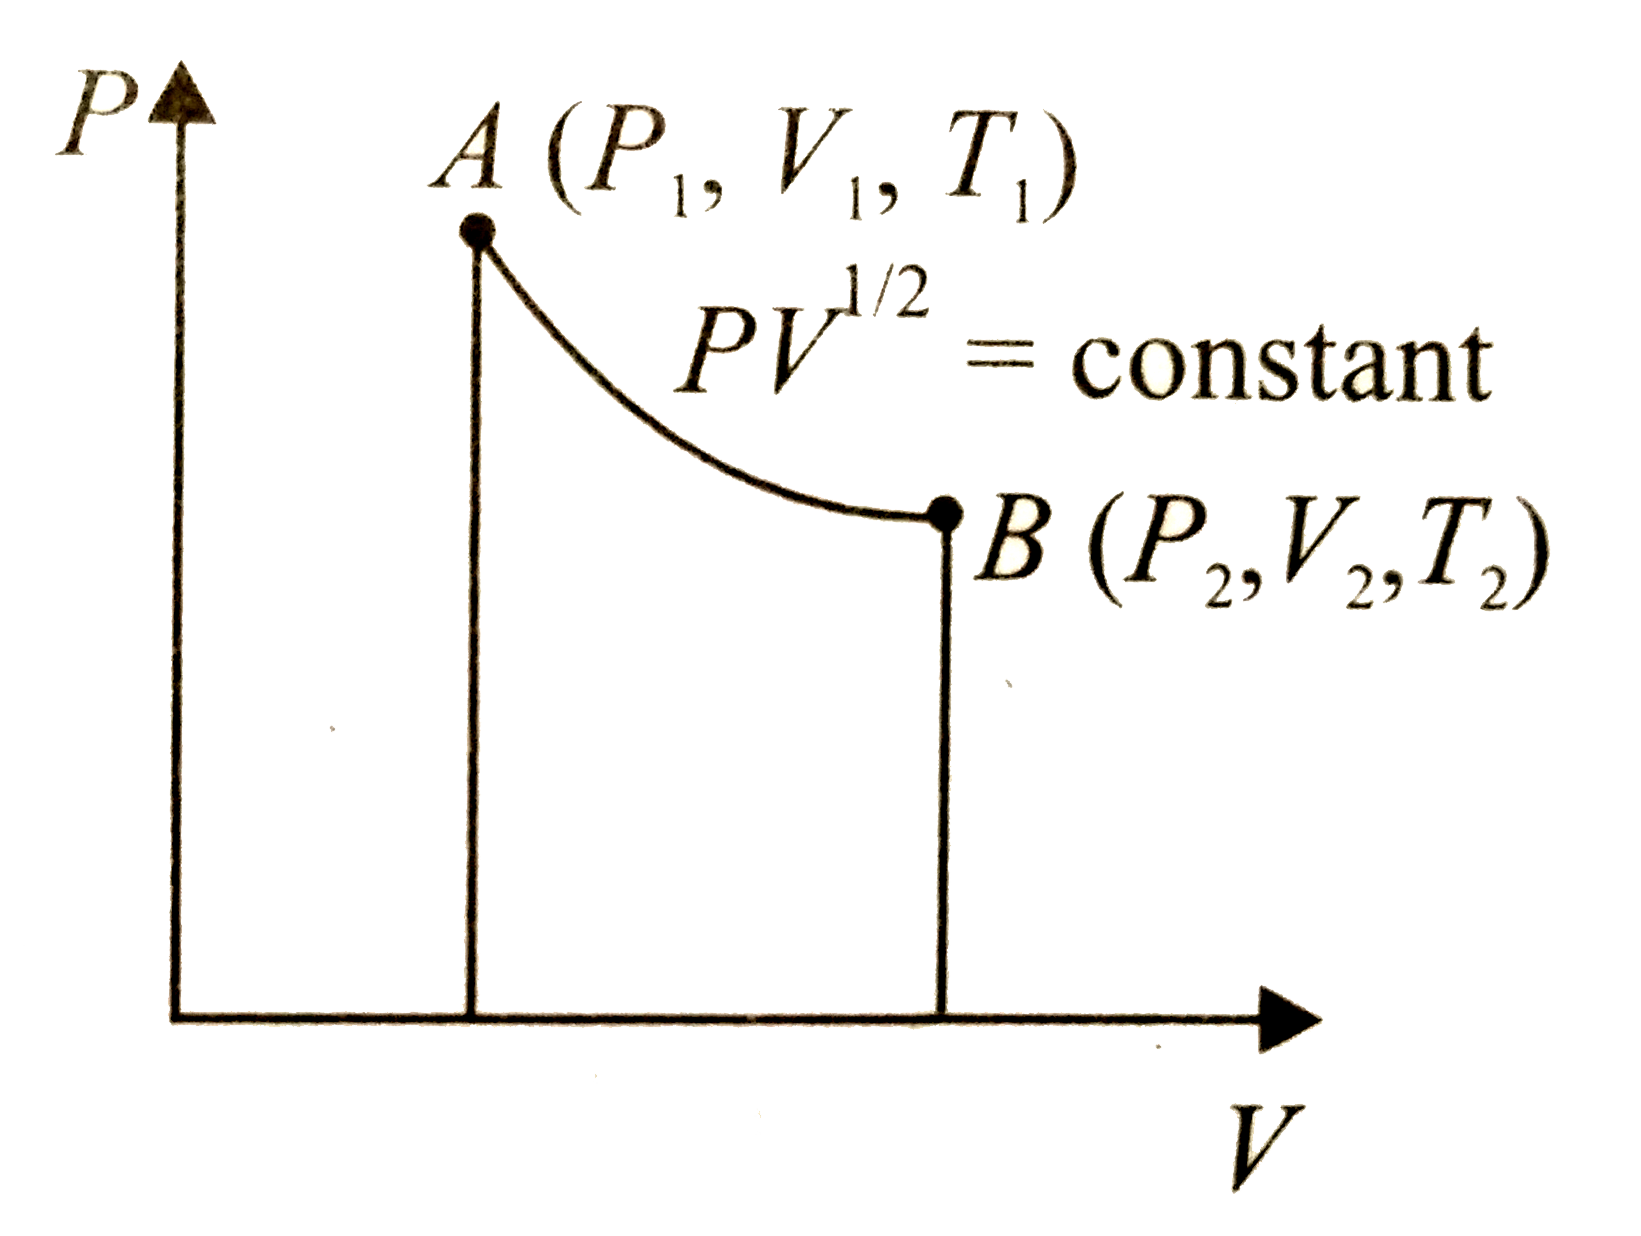
- One mole of an ideal gas at a temperature T(1) expands according to th...
Text Solution
|
- The V - i graph for a conductor at temperature T(1) and T(2) are as sh...
Text Solution
|
- Two different adiabatic parts for the same gas intersect two isotherma...
Text Solution
|
- 1 mole of an ideal gas in a cylindrical container have the P-V diagram...
Text Solution
|
- The velocity of sound waves in an ideal gas at temperatures T(1) K and...
Text Solution
|