


Similar Questions
Explore conceptually related problems
Recommended Questions
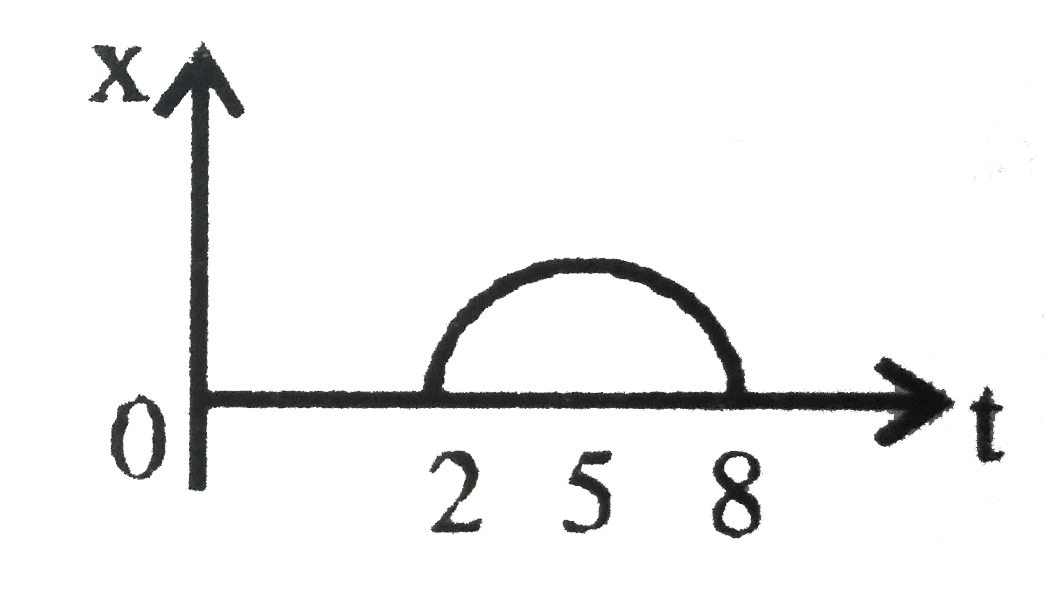
- Position time graph is shown which is a semicircle form t = 2 to t = 8...
Text Solution
|
- A cockroach moves rectilinearly such that after sometime t(0) let its ...
Text Solution
|
- The velocity-time graph of a body is given below. Find the average vel...
Text Solution
|
- Position time graph is shown which is a semicircle form t = 2 to t = 8...
Text Solution
|
- A point moves rectilinearly in on direction. Figure shows the distance...
Text Solution
|
- A particle is projected with a speed v and an angle theta to the horiz...
Text Solution
|
- X -अक्ष पर गतिमान एक कण का स्थिति समय (x-t) ग्राफ चित्र में प्रदर्शित ...
Text Solution
|
- The velocity time graph of a body moving in a straight line is shown. ...
Text Solution
|
- Find the position and velocity of x at time, t = 2 seconds
Text Solution
|