


Similar Questions
Explore conceptually related problems
Recommended Questions
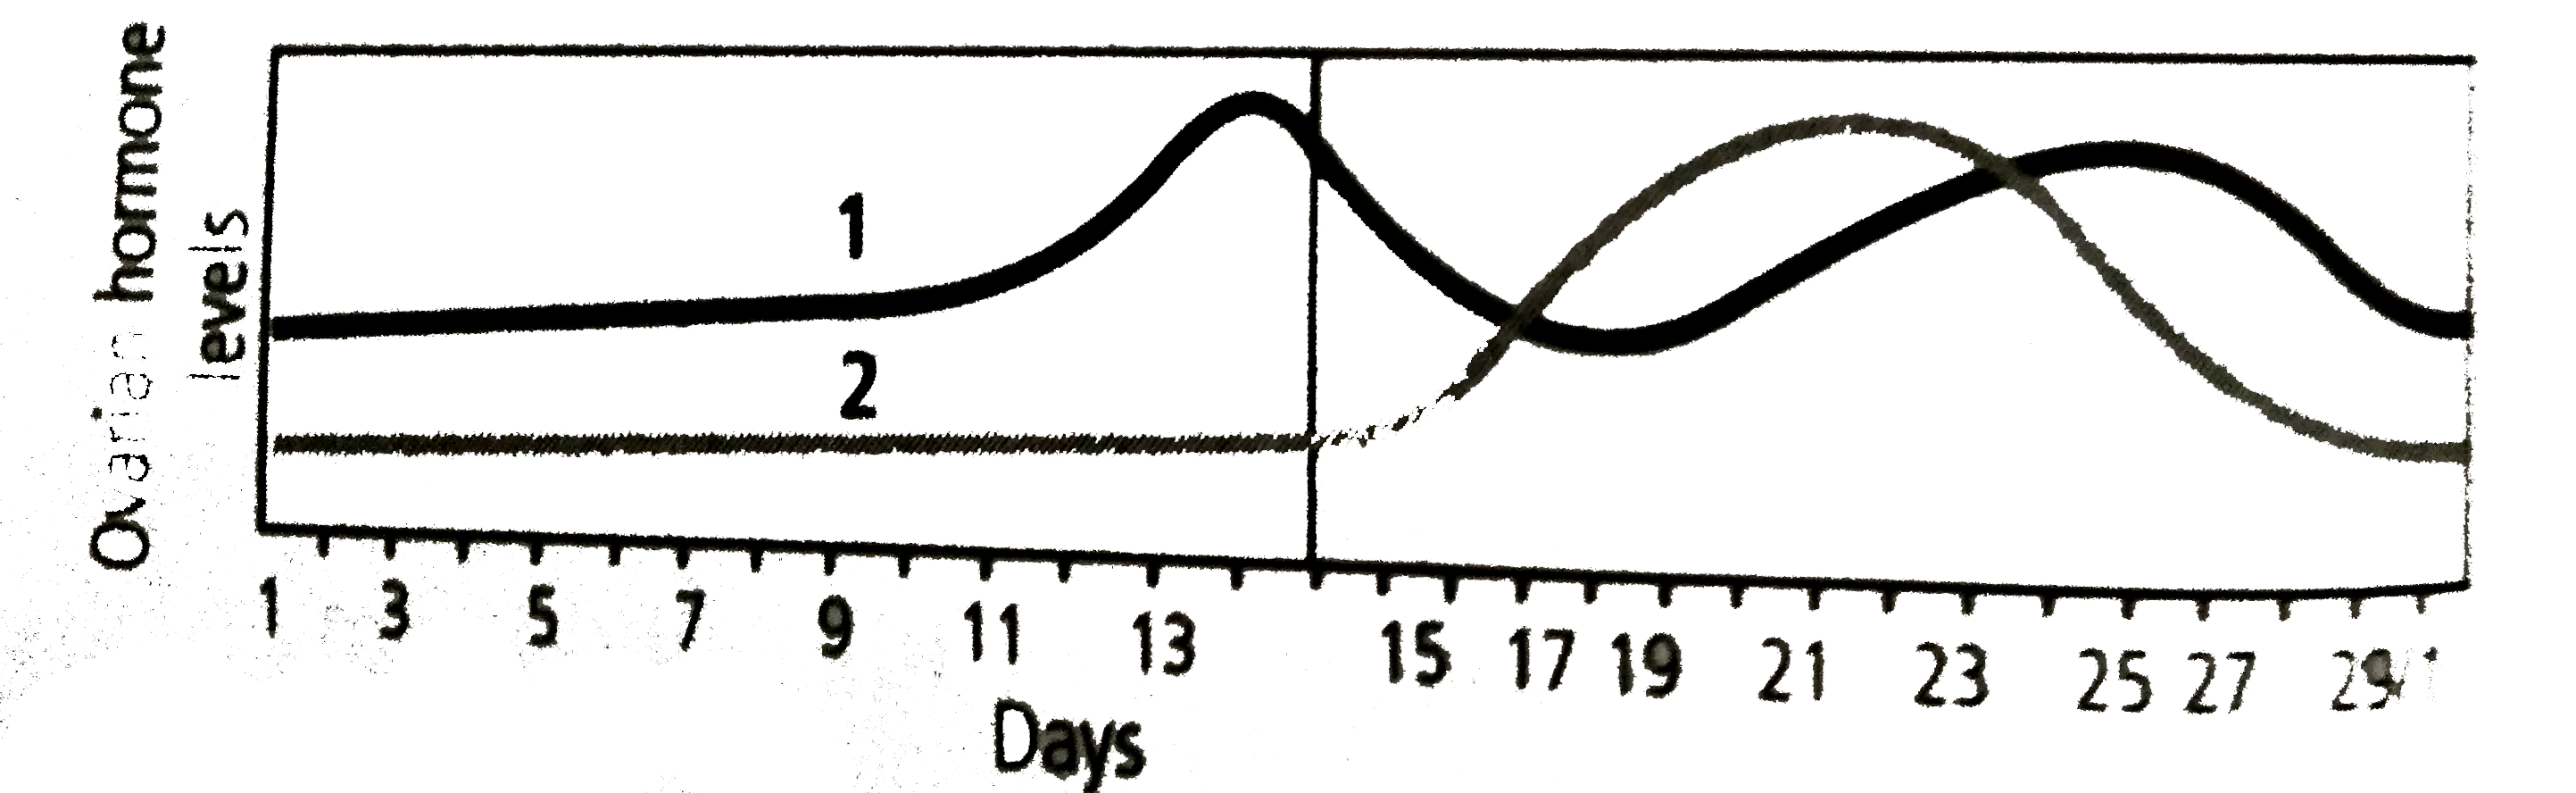
- The following graph shows the levels of ovarian hormones during a mens...
Text Solution
|
- The following grap[hs shows the lvevels of pituitary hormones during a...
Text Solution
|
- The following graph shows the levels of ovarian hormones during a mens...
Text Solution
|
- Explain the ovarian and uterine events that occur during a menstrual c...
Text Solution
|
- Describe the role of pituitary and ovarian hormones during the ...
Text Solution
|
- Explain the ovarian and uterine events that occur during a menstrual c...
Text Solution
|
- Desribe the roles of pituitary and ovarian hormones during the menstru...
Text Solution
|
- The following grap[hs shows the lvevels of pituitary hormones during a...
Text Solution
|
- The following graph shows the levels of ovarian hormones during a mens...
Text Solution
|