


Similar Questions
Explore conceptually related problems
Recommended Questions
- The given pie chart shows the amount of money spent by a school on var...
Text Solution
|
- The given pie chart shows the amount of money spent by a school on var...
Text Solution
|
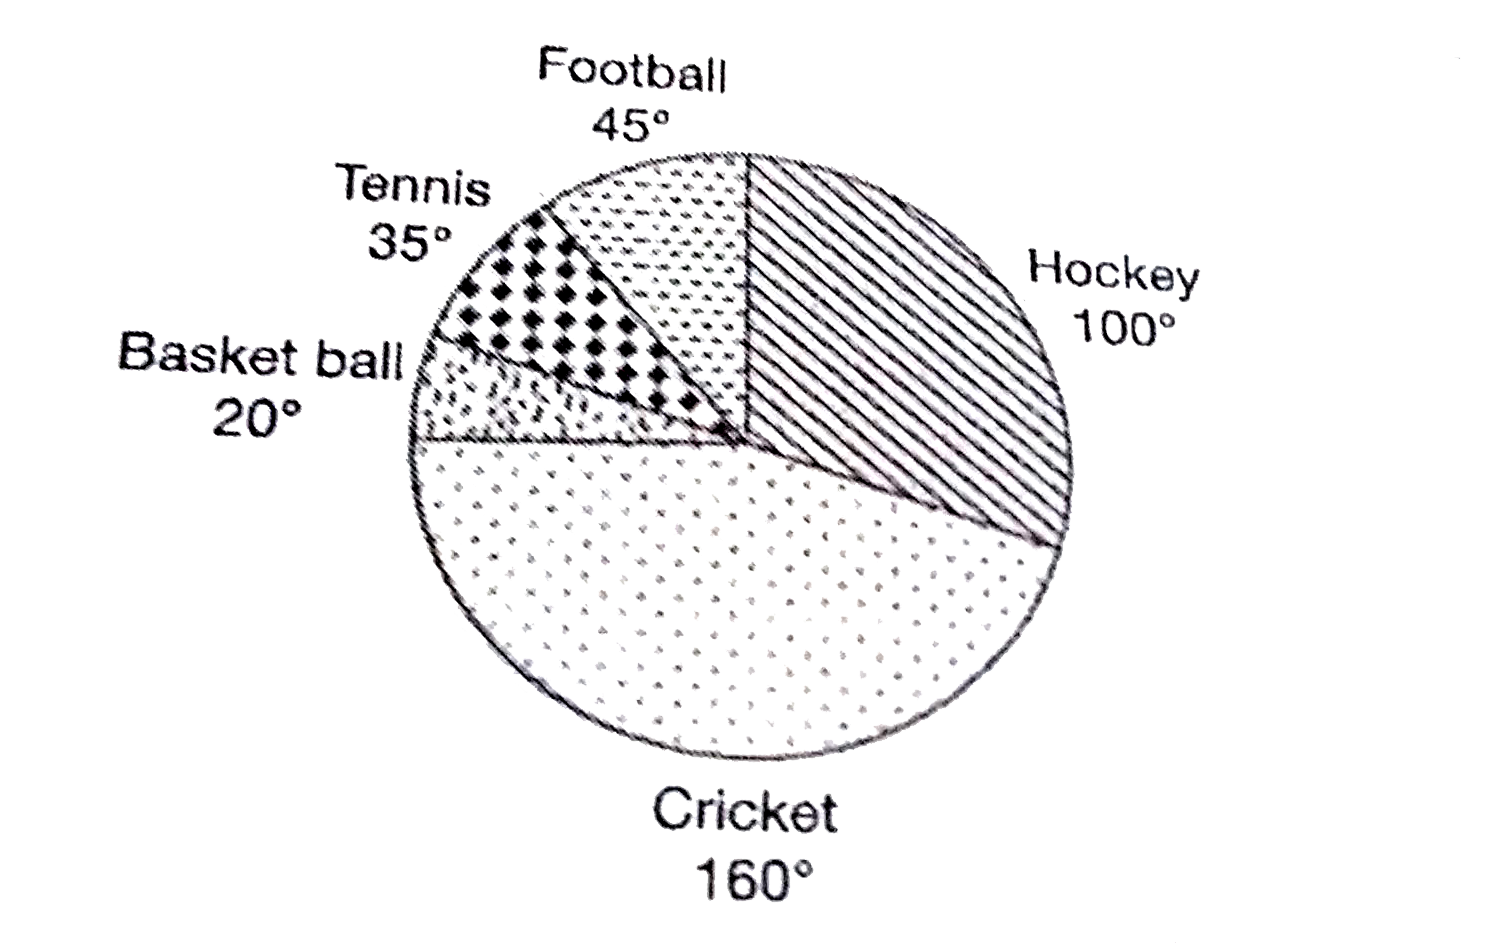
- Observe the pie diagram. If the amount spent on football per year is...
Text Solution
|
- The pie diagram represents the amount spent on different sports by a s...
Text Solution
|
- The pie chart, given here, shows the amount of money spent on various ...
Text Solution
|
- The pie chart, given here, shows the amount of money spent on various ...
Text Solution
|
- The pie chart, given here, shows the amount of money spent on various ...
Text Solution
|
- The following pie-chart represents the amount spent on different spo...
Text Solution
|
- एक स्कूल के प्रशासन द्वारा एक कैलेंडर वर्ष में विभिन्न खेलों पर किए गए...
Text Solution
|