A
B
C
D
Text Solution
Verified by Experts
The correct Answer is:


Topper's Solved these Questions
Similar Questions
Explore conceptually related problems
RESONANCE-GASEOUS STATE-PHYSICAL CHMISTRY (Gaseous State)
- If the weight of 5.6 litres of a gas at N.T.P. is 11 gram. The gas may...
Text Solution
|
- The density of vapour of a substance (X) at 1 atm pressure and 500 K ...
Text Solution
|
- The volume of 2.8g of CO at 27^(@)C and 0.821 atm pressure is (R=0.082...
Text Solution
|
- For a real gas 'G' Z gt1 as STP Then for 'G' : Which of the followin...
Text Solution
|
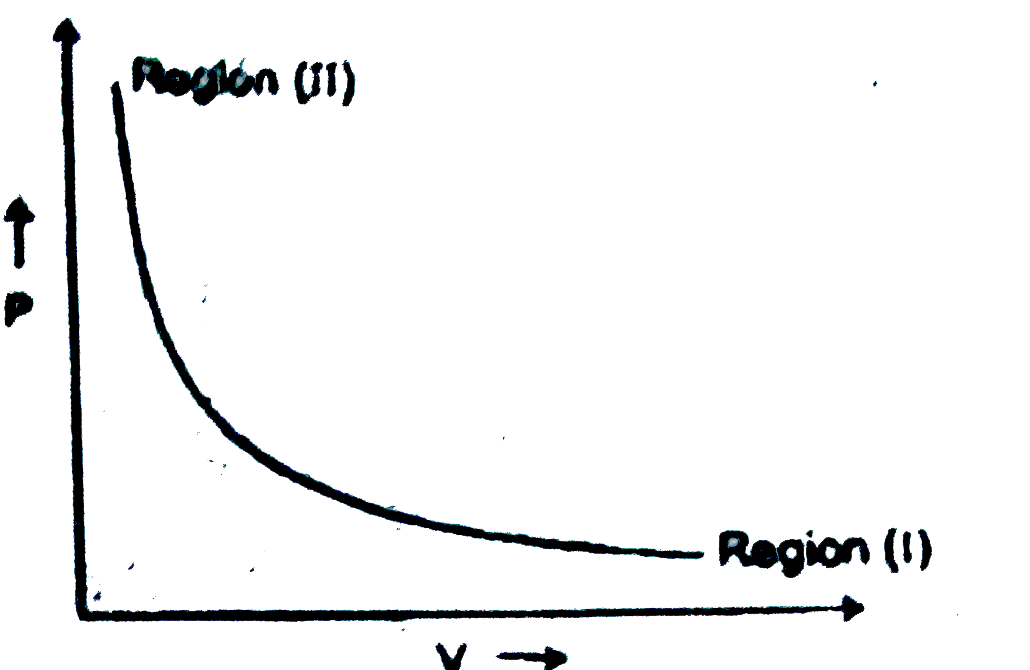
- Following graph represents a pressure (P) volume (V) relationship at a...
Text Solution
|
- A small bubble rises from the bottom of a lake, where the temperature ...
Text Solution
|
- Oxygen gas generated by the decomposition of potassium chlorate is col...
Text Solution
|
- The root mean square speed of hydrogen is sqrt(5) times than that of n...
Text Solution
|
- A gaseous mixture containing He,CH(4) and SO(2) was allowed was allow...
Text Solution
|
- 6xx10^(22) gas molecules each of mass 10^(-34)kg are taken in a vessel...
Text Solution
|
- Two flask A and B of equal volumes maintained at temperature 300K an...
Text Solution
|
- The density of gas A is twice that of B at the same temperature the mo...
Text Solution
|
- A ballon weighing 50 kg is filled with 685kg of helium at 1atm pressur...
Text Solution
|
- At 2173K temp, and 9 atm pressure, the compressibility fog a gas is 0....
Text Solution
|
- Calculate the volume occupied by 16gram O(2) at 300K and 8.31 Mpa if (...
Text Solution
|
- Density of dry air ( only N(2) and O(2)) is 1.24g litre^(-1) at 760 m ...
Text Solution
|
- The mass of molecule A is twice the mass of molecule B. The rms speed ...
Text Solution
|
- In the above figure mercury columns of 10 cms each are trapped between...
Text Solution
|
- 3.06 L of H(2)O vapour is taken at a pressure of 1 atm and 373 K . It ...
Text Solution
|
- A mixture of two gases A and B in the mole ratio 2:3 is kept in a 2 li...
Text Solution
|