A
B
C
D
Text Solution
Verified by Experts
The correct Answer is:


Topper's Solved these Questions
Similar Questions
Explore conceptually related problems
ALLEN-TEST PAPERS-PAPER 3
- A steel ball strikes a fixed smooth steel plate placed on a horizontal...
Text Solution
|
- A ball is thrown vertically upwards. It was observed at a height h twi...
Text Solution
|
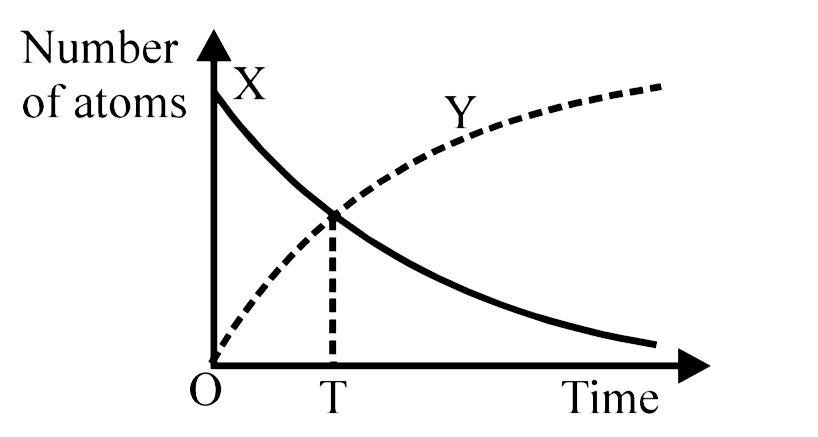
- The graph represents the decay of a newly-prepared sample of radioacti...
Text Solution
|
- Four tuning forks of frequencies 200,201,204 and 206 Hz are sounded to...
Text Solution
|
- Electrons used in an electron microscope are accelerated by a voltage ...
Text Solution
|
- A bead is free to slide down a smooth wire tightly stretched between p...
Text Solution
|
- As shown in the figure, initially both th springs are in normal length...
Text Solution
|
- One mole of an ideal gas undergoes a process whose molar heat capacity...
Text Solution
|
- A diatomic gas (gamma=1.4) does 2000J of work when it is expanded isob...
Text Solution
|
- n moles of an ideal triatomic linear gas undergoes a process in which ...
Text Solution
|
- A particle with the potentila energy shown in the graph is moving to t...
Text Solution
|
- The logic circuit shown has the input waveforms 'A' and 'B' as shown. ...
Text Solution
|
- If the B-H curves of two samples of P and Q of iron are as shown below...
Text Solution
|
- The image formed by an objective of a telescope is-
Text Solution
|
- In an amplitude modulated wave for audio frequency of 500 "cycle"//sec...
Text Solution
|
- Length of a year on a planet is the duration in which it completes one...
Text Solution
|
- The specific conductivity of a saturated solution of AgCl is 3.40xx10^...
Text Solution
|
- A solid is formed and it has three types of atoms X, Y and Z, X forms ...
Text Solution
|
- When 20g of naphtholic acid (C(11)H(8)O(2)) is dissolved in 50g of ben...
Text Solution
|
- Number of atoms present in 224 dm^(3) of oxygen gas at STP is :-
Text Solution
|