Home
Class 10
MATHS
The shaded portion of Figure shows the ...

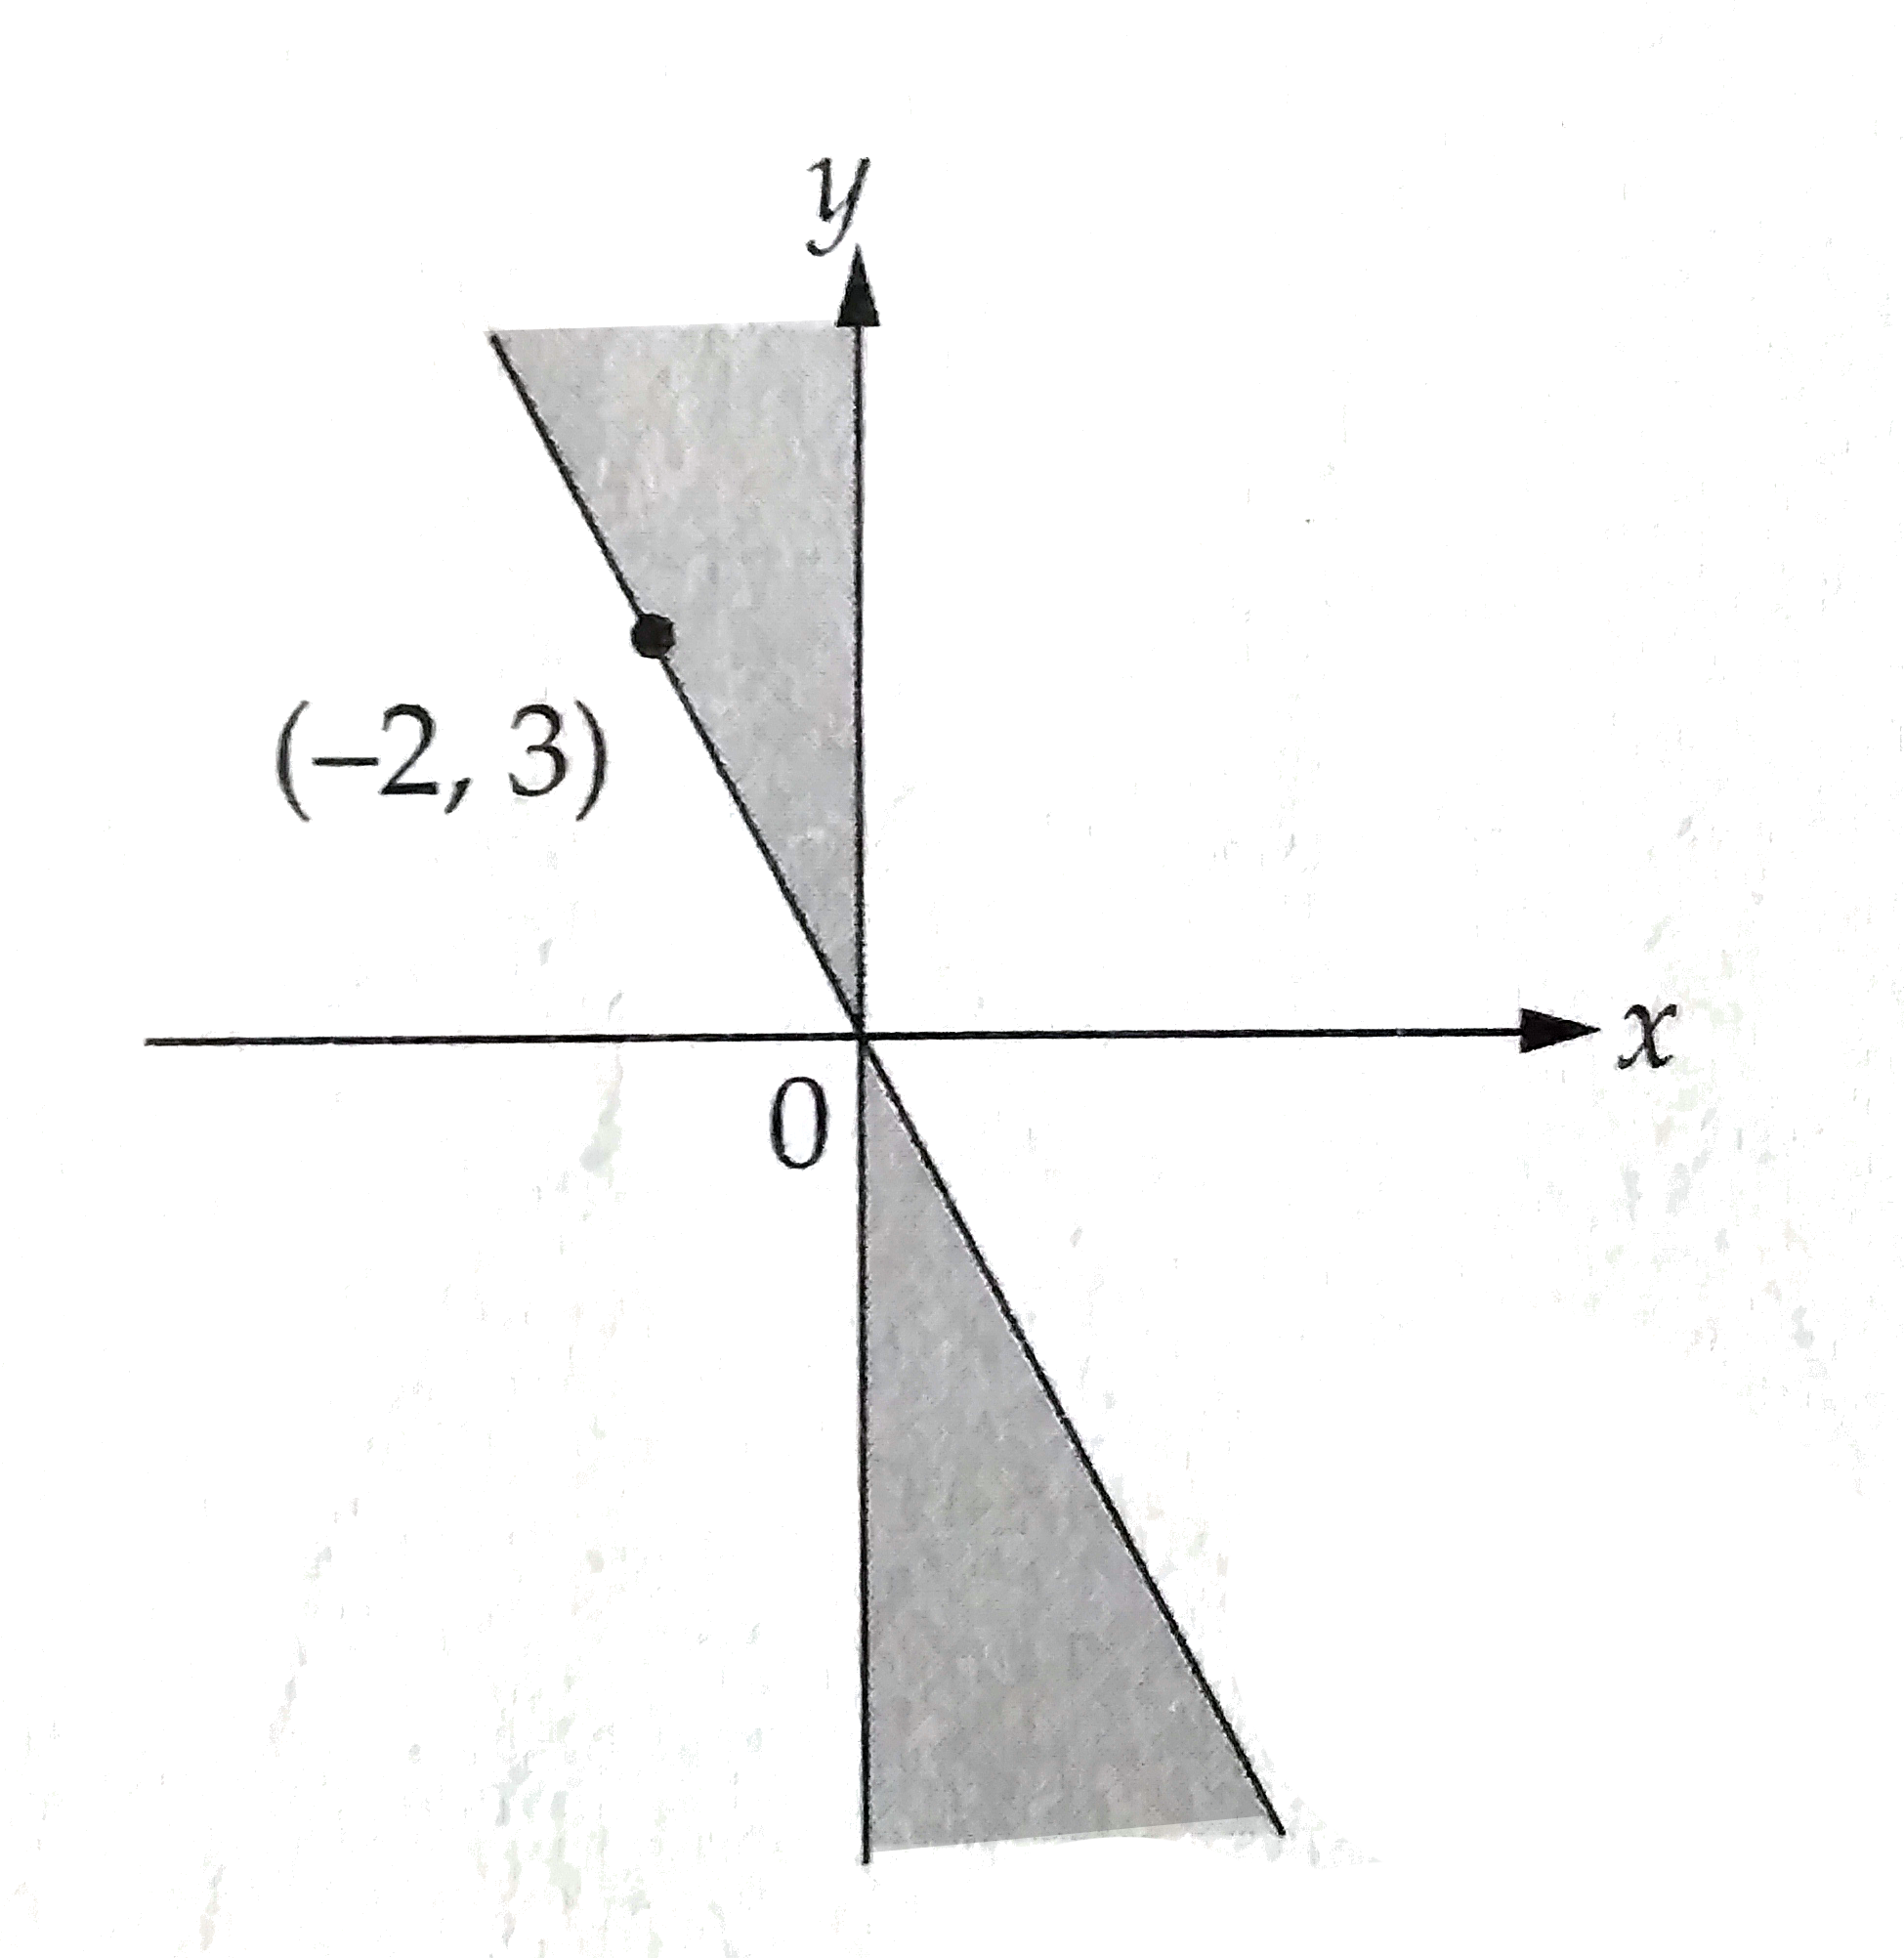
The shaded portion of Figure shows the graph of which of the following ?

A

`x(y-(2)/(3)x)gt 0`

B

`x(y-(3)/(2)x)ge 0`

C

`x(y+(3)/(2))ge 0`

D

`x(y+(3)/(2)x)le 0`

Text Solution

Verified by Experts

The correct Answer is:
D

First find the equation of the line to help you eliminate answer choices. The line passes through point (-2, 3) and the origin, so its equation is `y = -(3)/(2)x`.
According to the graph, you're looking for the answer choice that has the following properties : `x le 0` and `y ge - (3)/(2)x` (the shaded protion of the second quadrant)
IN ADDITION
`x ge 0` and `y le - (3)/(2)x` (the shaded portion of the fourth quadrant).
To fulfill the first set of requirements, it is necessary that `x le 0` and `y + (3)/(2)x ge 0` .
The product of these two expressions has to be negative, because the product of a negative and a positive is always negative. Therefore, `(x)(y+(3)/(2)x)le 0`. To fulfill the second set of requirements, it is necessary that `x ge 0` and `y+(3)/(2)x le 0`.
Once again, the product of these two expression has to be negative, resulting in the same inequality.
Therefore, `x(y+(3)/(2)x)le 0` fits the shaped portions of the graph.
Promotional Banner

Topper's Solved these Questions

  • COORDINATE GEOMETRY

    KAPLAN|Exercise COORDINATE GEOMETRY FOLLOW - UP TEST|6 Videos
  • CIRCLES

    KAPLAN|Exercise Multiple Choice Question|12 Videos
  • EXPONENTS, RADICALS, POLYNOMIALS, AND RATIONAL EXPRESSIONS

    KAPLAN|Exercise Multiple Choice Question|20 Videos

Similar Questions

Explore conceptually related problems

The graph in Figure could be the graph of which of the following functions ?

If the accomanying figure above shows the graph of function f, which of the following could represent the graph of y=f(x+1) ?

If (x,y) represents a point on the the graph of y=2x+1 , which of the following could be a portion of the graph of the set of points (x,y^(2)) ?

In Figure shows the graph of f(x) , what is the value of f(f(3)) ?

The current i in an induction coil varies with time according to the graph shown in figure. Which of the following graph shows induced emf in the coil with time:

The shaded region in the given figure is

The shaded region in the given figure is

Find the area of the shaded portion in each of the following diagrams :

Find the area of the shaded portion in each of the following diagrams :

Which of the following shaded regions shows the graph of the inequality y le |x - 2| ?