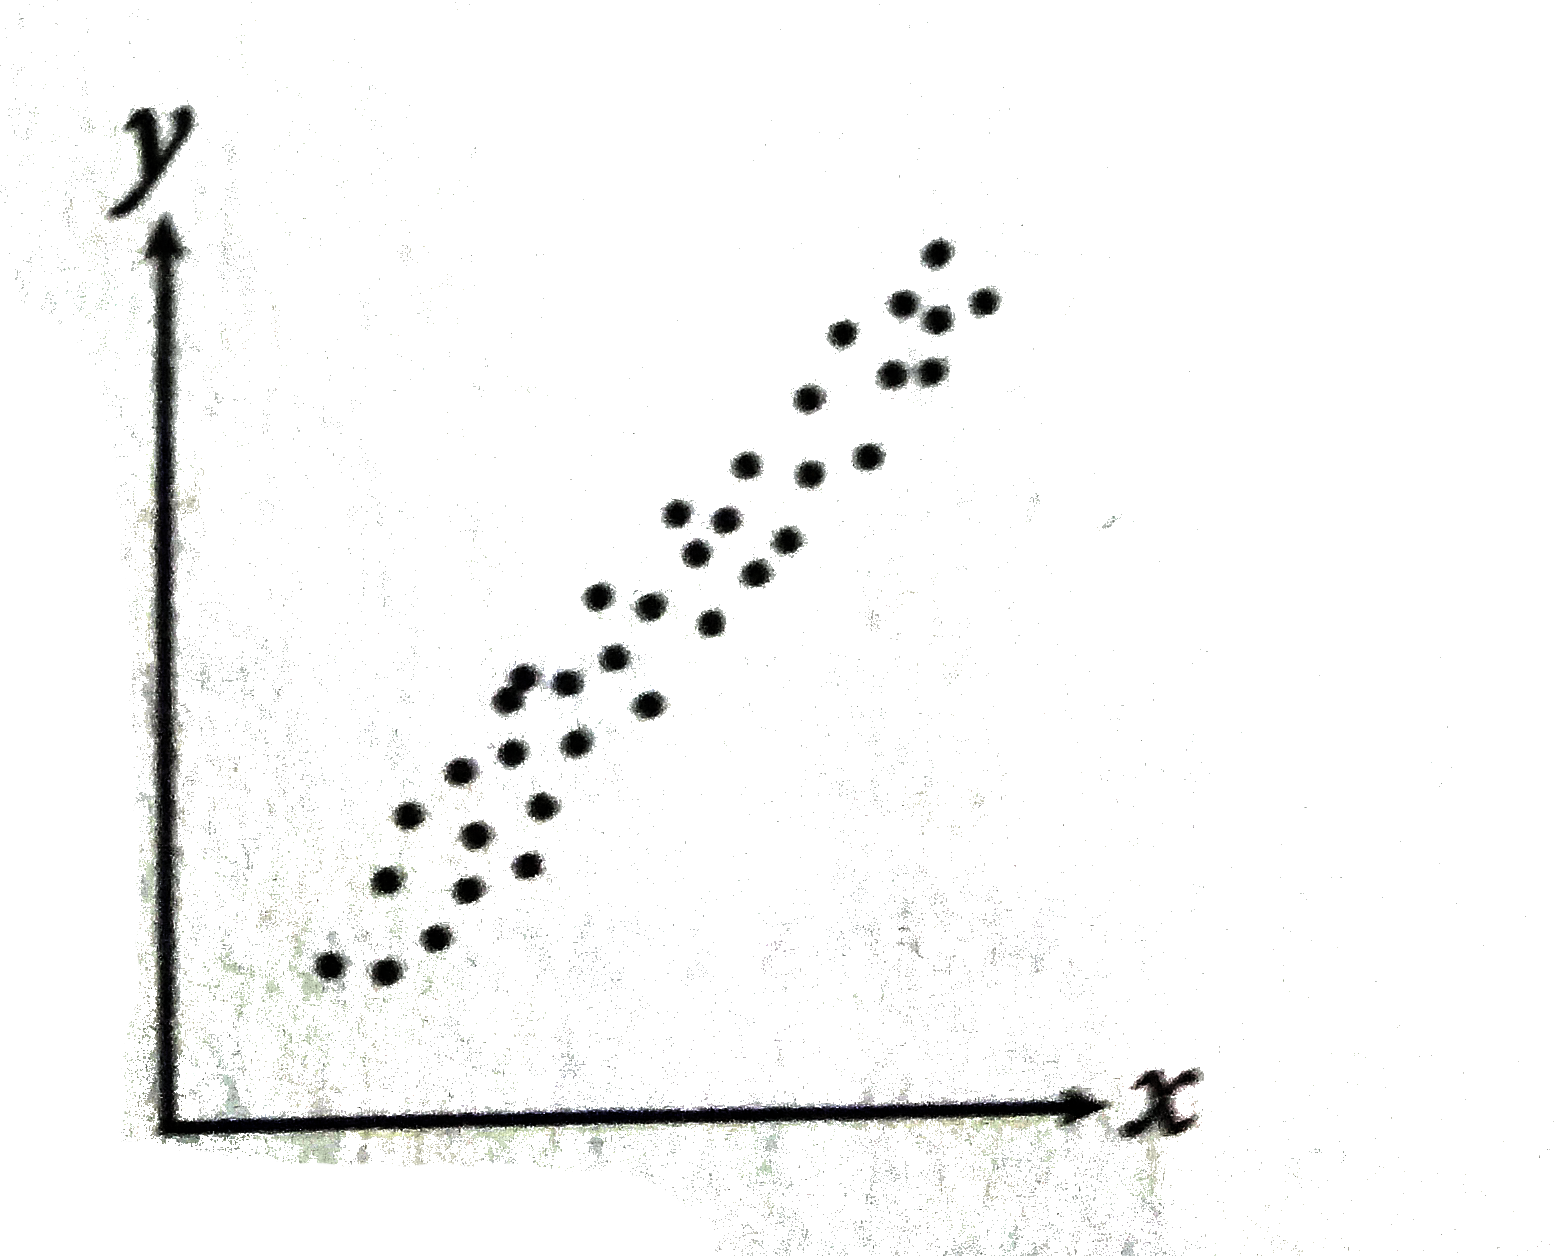
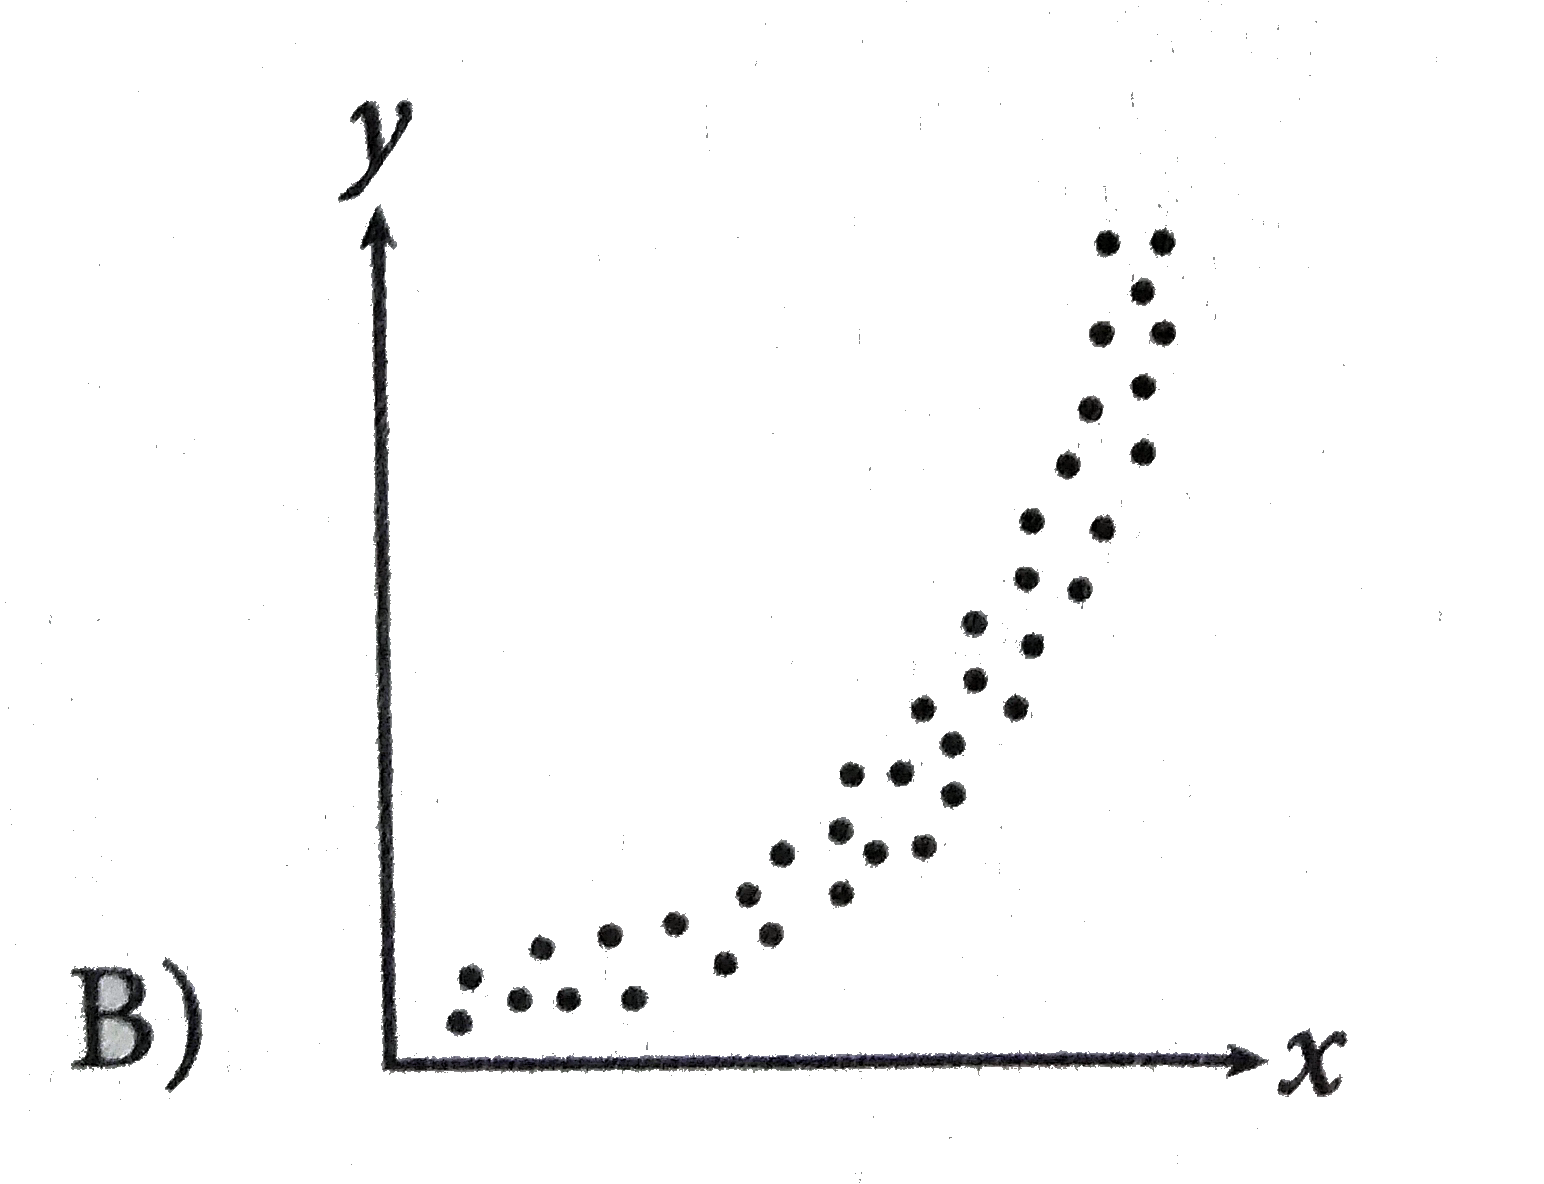
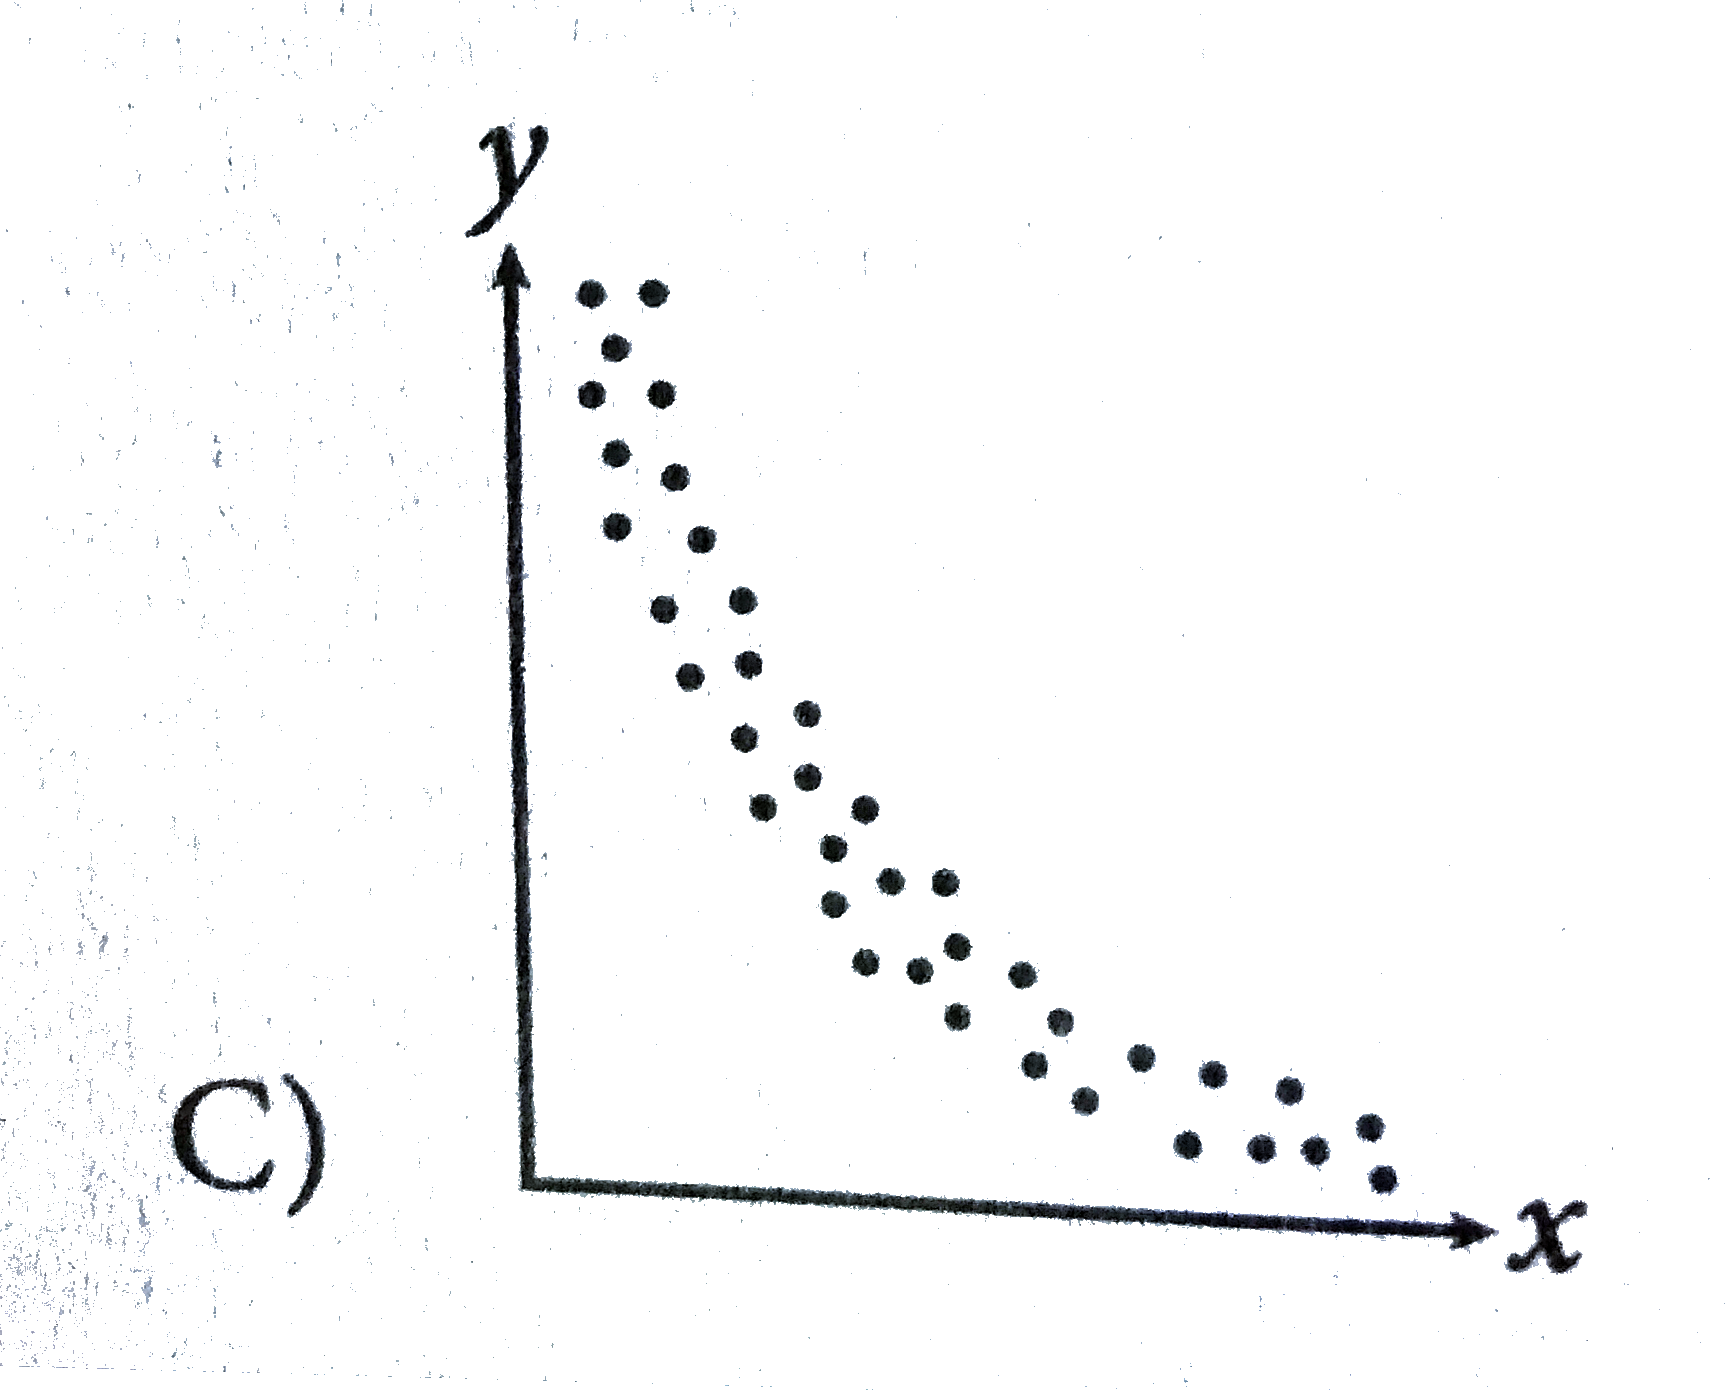
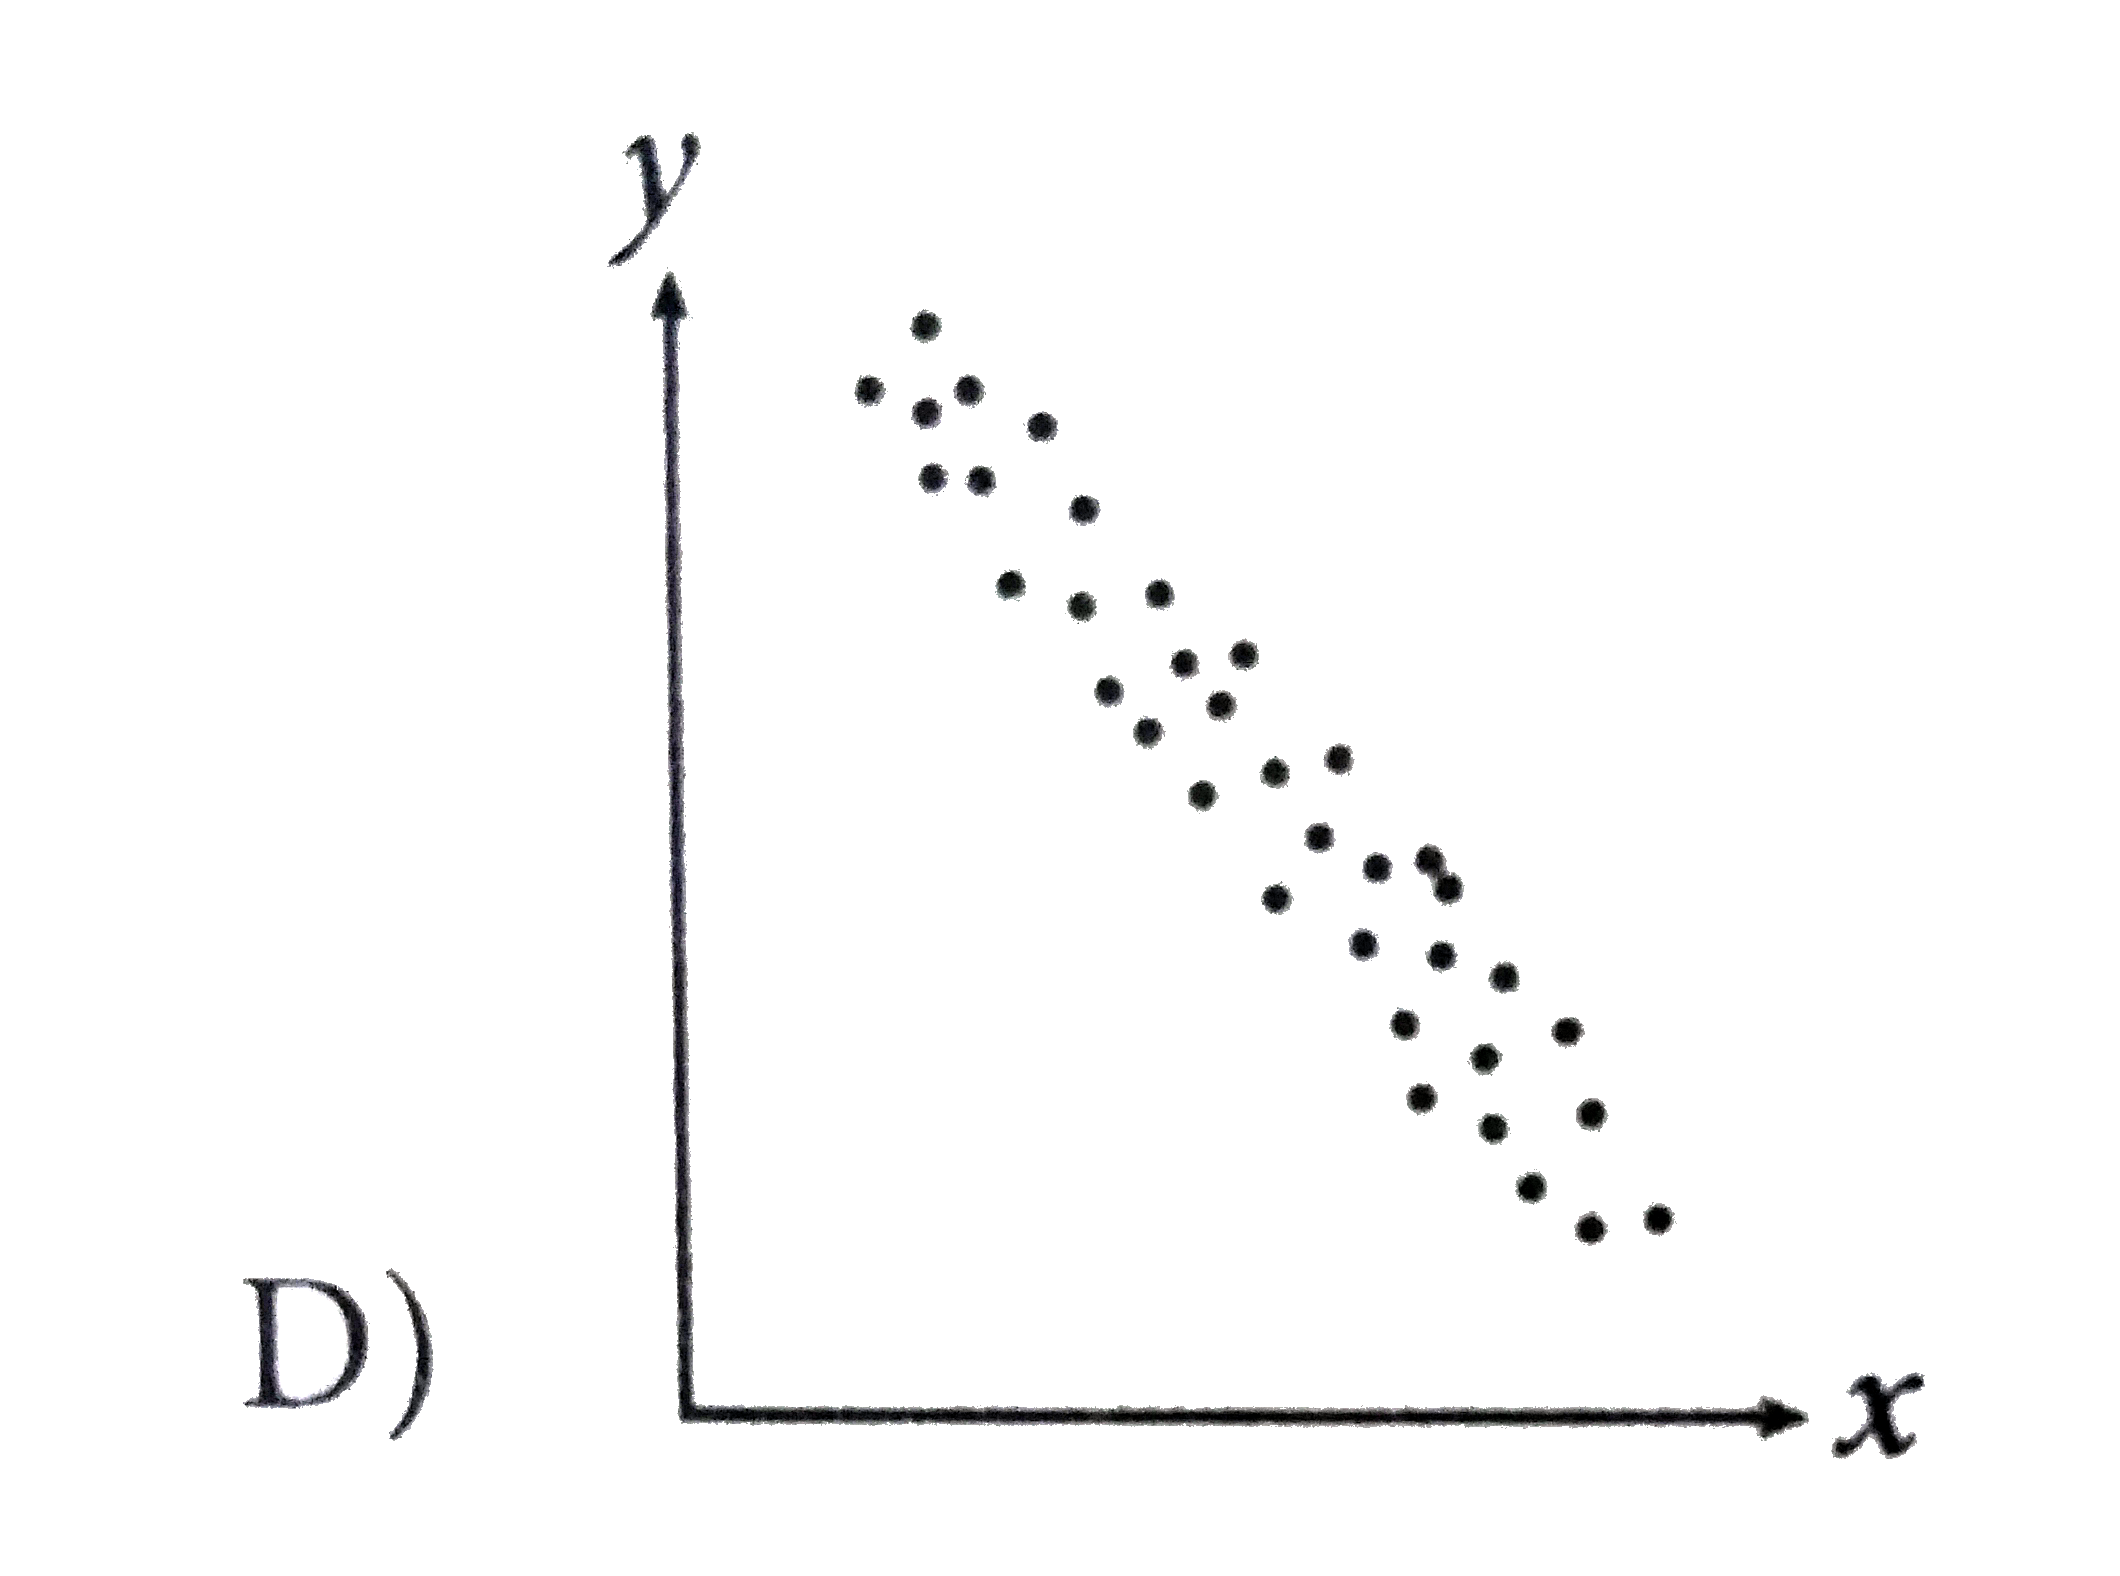
Home
Class 10
MATHS
Which of the following scatterplot could...

Which of the following scatterplot could be modeled by the equation `y=(a)/(b^(x))`, where a and b are constant such that `agt1 and xlt-1`?

A

B

C

D

Text Solution

AI Generated Solution

The correct Answer is:
To solve the problem of identifying which scatterplot could be modeled by the equation \( y = \frac{a}{b^x} \) where \( a > 1 \) and \( x < -1 \), we can follow these steps: ### Step 1: Understand the Equation The equation \( y = \frac{a}{b^x} \) can be rewritten as \( y = a \cdot b^{-x} \). This shows that as \( x \) increases (becomes less negative), \( y \) will decrease because \( b^{-x} \) will increase. **Hint:** Rewrite the equation in a form that makes it easier to analyze the behavior of \( y \) as \( x \) changes. ### Step 2: Analyze the Conditions Given that \( a > 1 \) and \( x < -1 \), we know: - \( a \) is a positive constant greater than 1. - Since \( x < -1 \), the values of \( x \) are negative, which means \( -x \) is positive. **Hint:** Consider how the value of \( x \) affects the output \( y \) based on the conditions provided. ### Step 3: Determine the Behavior of the Function As \( x \) becomes more negative (i.e., \( x \) approaches negative infinity), \( b^{-x} \) will grow larger. Thus, \( y \) will increase without bound. Conversely, as \( x \) approaches -1 from the left, \( y \) will be at a finite value. **Hint:** Think about how the graph of the function behaves as \( x \) changes, especially for values less than -1. ### Step 4: Evaluate the Scatterplots Now, we need to look at the provided scatterplots (let's assume they are labeled A, B, C, D) and determine which one reflects the behavior we analyzed: - The correct scatterplot should show an increasing trend for \( x < -1 \). **Hint:** Look for a scatterplot that shows an upward trend as \( x \) values become less negative. ### Step 5: Eliminate Incorrect Options From the analysis, we can eliminate options that do not show the expected behavior: - If a scatterplot shows a decreasing trend or is flat for \( x < -1 \), it cannot be modeled by our equation. **Hint:** Cross out any scatterplots that do not match the increasing behavior for negative \( x \). ### Step 6: Identify the Correct Scatterplot After evaluating the options, we find that scatterplot B shows the correct increasing trend for \( x < -1 \), while scatterplots A, C, and D do not fit the model. **Final Answer:** The correct scatterplot that could be modeled by the equation \( y = \frac{a}{b^x} \) is **B**.

To solve the problem of identifying which scatterplot could be modeled by the equation \( y = \frac{a}{b^x} \) where \( a > 1 \) and \( x < -1 \), we can follow these steps: ### Step 1: Understand the Equation The equation \( y = \frac{a}{b^x} \) can be rewritten as \( y = a \cdot b^{-x} \). This shows that as \( x \) increases (becomes less negative), \( y \) will decrease because \( b^{-x} \) will increase. **Hint:** Rewrite the equation in a form that makes it easier to analyze the behavior of \( y \) as \( x \) changes. ### Step 2: Analyze the Conditions ...
Promotional Banner

Topper's Solved these Questions

  • RATES , RATIOS , PROPORTIONS, AND PERCENTAGES

    KAPLAN|Exercise Multiple Choice Question|20 Videos
  • SIMILARITY, CONGRUENCE, AND PROOFS

    KAPLAN|Exercise Multiple Choice Question|10 Videos

Similar Questions

Explore conceptually related problems

Form the differential equation of y=a(x+b) , where a,b are constants.

Which of the following is best modeled using a linear regression equation, y= ax+b, where a lt 0 ?

The data in which of the following scatterplots would be best modeled by a quadratic function in which the x^(2) term has a negative coefficient?

Which of the following scatterplots shows a ralationship that is appropriately modeled with the equation y=- ax ^(2) + bx-c, where a and c are negative and b is positive ?

For which of the following values of a and b does the equation y = ax ^(b) model the data in the scatterplot above ?

Which of the following equations best models the data shown in the scatterplot above?

Let f:(0,1)->R be defined by f(x)=(b-x)/(1-bx) , where b is constant such that 0 ltb lt 1 .then ,

Which of the following equivalent to the expressions ((a^((1)/(4))b^(3))/(a^(2)b^((1)/(2))) ? Where agt1 and bgt1

From the differential equation of the family of curves y=asin(x+b) , where a and b are arbitrary constants.

KAPLAN-SCATTERPLOTS -Multiple Choice Question
  1. Wesley went to an amusement park with his family. He paid for his own ...

    Text Solution

    |

  2. The data in which of the following scatterplots would be best modeled ...

    Text Solution

    |

  3. The table above shows the cummulative number of participants eliminate...

    Text Solution

    |

  4. Nine data point were used to generate the scatterplot shown. Assuming ...

    Text Solution

    |

  5. When water is heated in a closed system, the vapor pressure increase s...

    Text Solution

    |

  6. Which of the following equations best models the data shown in the sca...

    Text Solution

    |

  7. The figure above shows the number of emails sent per day plotted again...

    Text Solution

    |

  8. There are more than 250 known species of monkeys in the world. The sca...

    Text Solution

    |

  9. Which of the following scatterplot could be modeled by the equation y=...

    Text Solution

    |

  10. Sea ice extent is a measurement of the area of ocean with at least 15%...

    Text Solution

    |

  11. Sea ice extent is a measurement of the area of ocean with at least 15%...

    Text Solution

    |

  12. Sea ice extent is a measurement of the area of ocean with at least 15%...

    Text Solution

    |

  13. A dietician working in the childrens ward at a hospital is monitoring ...

    Text Solution

    |

  14. A dietician working in the childrens ward at a hospital is monitoring ...

    Text Solution

    |

  15. As the elevation above sea level increase, the corresponding air press...

    Text Solution

    |

  16. As the elevation above sea level increase, the corresponding air press...

    Text Solution

    |