A
B
C
D
Text Solution
Verified by Experts
The correct Answer is:


KAPLAN-TWO-WAY TABLES, STATISTIC , AND PROBABILITY-Multiple Choice Question
- A magnet school is a free public school that has a fused theme. Accord...
Text Solution
|
- Many people shop online primarily because they get access to product ...
Text Solution
|
- Phase I clinical trails are run to determine the safely of all new dr...
Text Solution
|
- In a survey of 1,600 adults in the United States, 48% indicated that t...
Text Solution
|
- A medical practice surveyed a random sample of 80 patients to determin...
Text Solution
|
- Unemployment rates in the U.S. for the first four months of 2015 are ...
Text Solution
|
- Luge is a winter sport in which a person slides down an ice track feet...
Text Solution
|
- Frederick is a business major and is conducting a study to determine t...
Text Solution
|
- A study of gasoline prices across a particular state showed that the s...
Text Solution
|
- Brian and several of his work colleagues are on a kickball team togeth...
Text Solution
|
- The bar graph shows the result of a grammar quiz in a language arts cl...
Text Solution
|
- The average gas mileage for n vehicles on one car lot is 21 miles per ...
Text Solution
|
- Five numbers are given by expressions x, 2x-3, 2x+1, 3x-4 and 3x+1. If...
Text Solution
|
- According to the information in the table, which of the following corr...
Text Solution
|
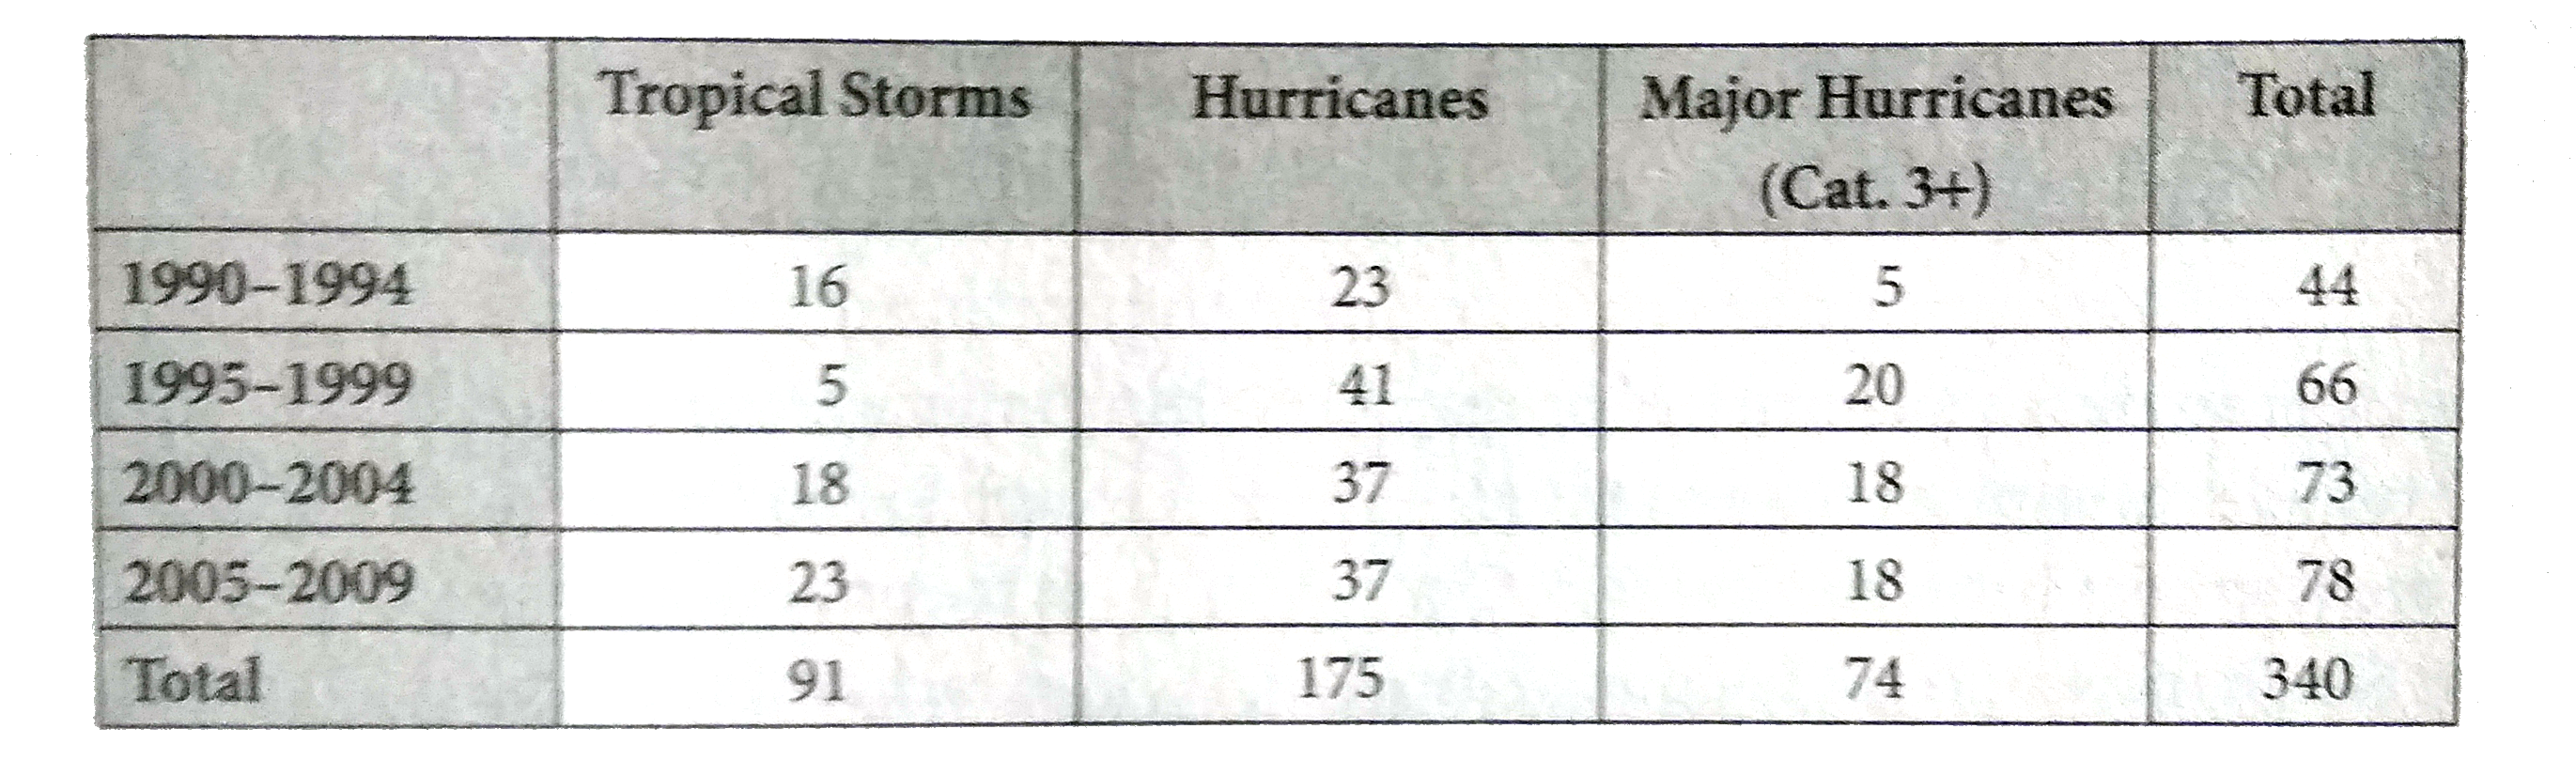
- The table above summarizes strom activity in the Atlantic Ocean betwee...
Text Solution
|
- The students in an environmental science class will be randomly assing...
Text Solution
|
- The table above is a summery of prices for round-trip airplane tickets...
Text Solution
|
- Airlines C and F offer six nonstop flights each to San Francisco throu...
Text Solution
|
- The table above shows the distribution of vehicles at a used car lot b...
Text Solution
|
- Based on the table, if a single vehicles is selected at random from al...
Text Solution
|