


Similar Questions
Explore conceptually related problems
Recommended Questions
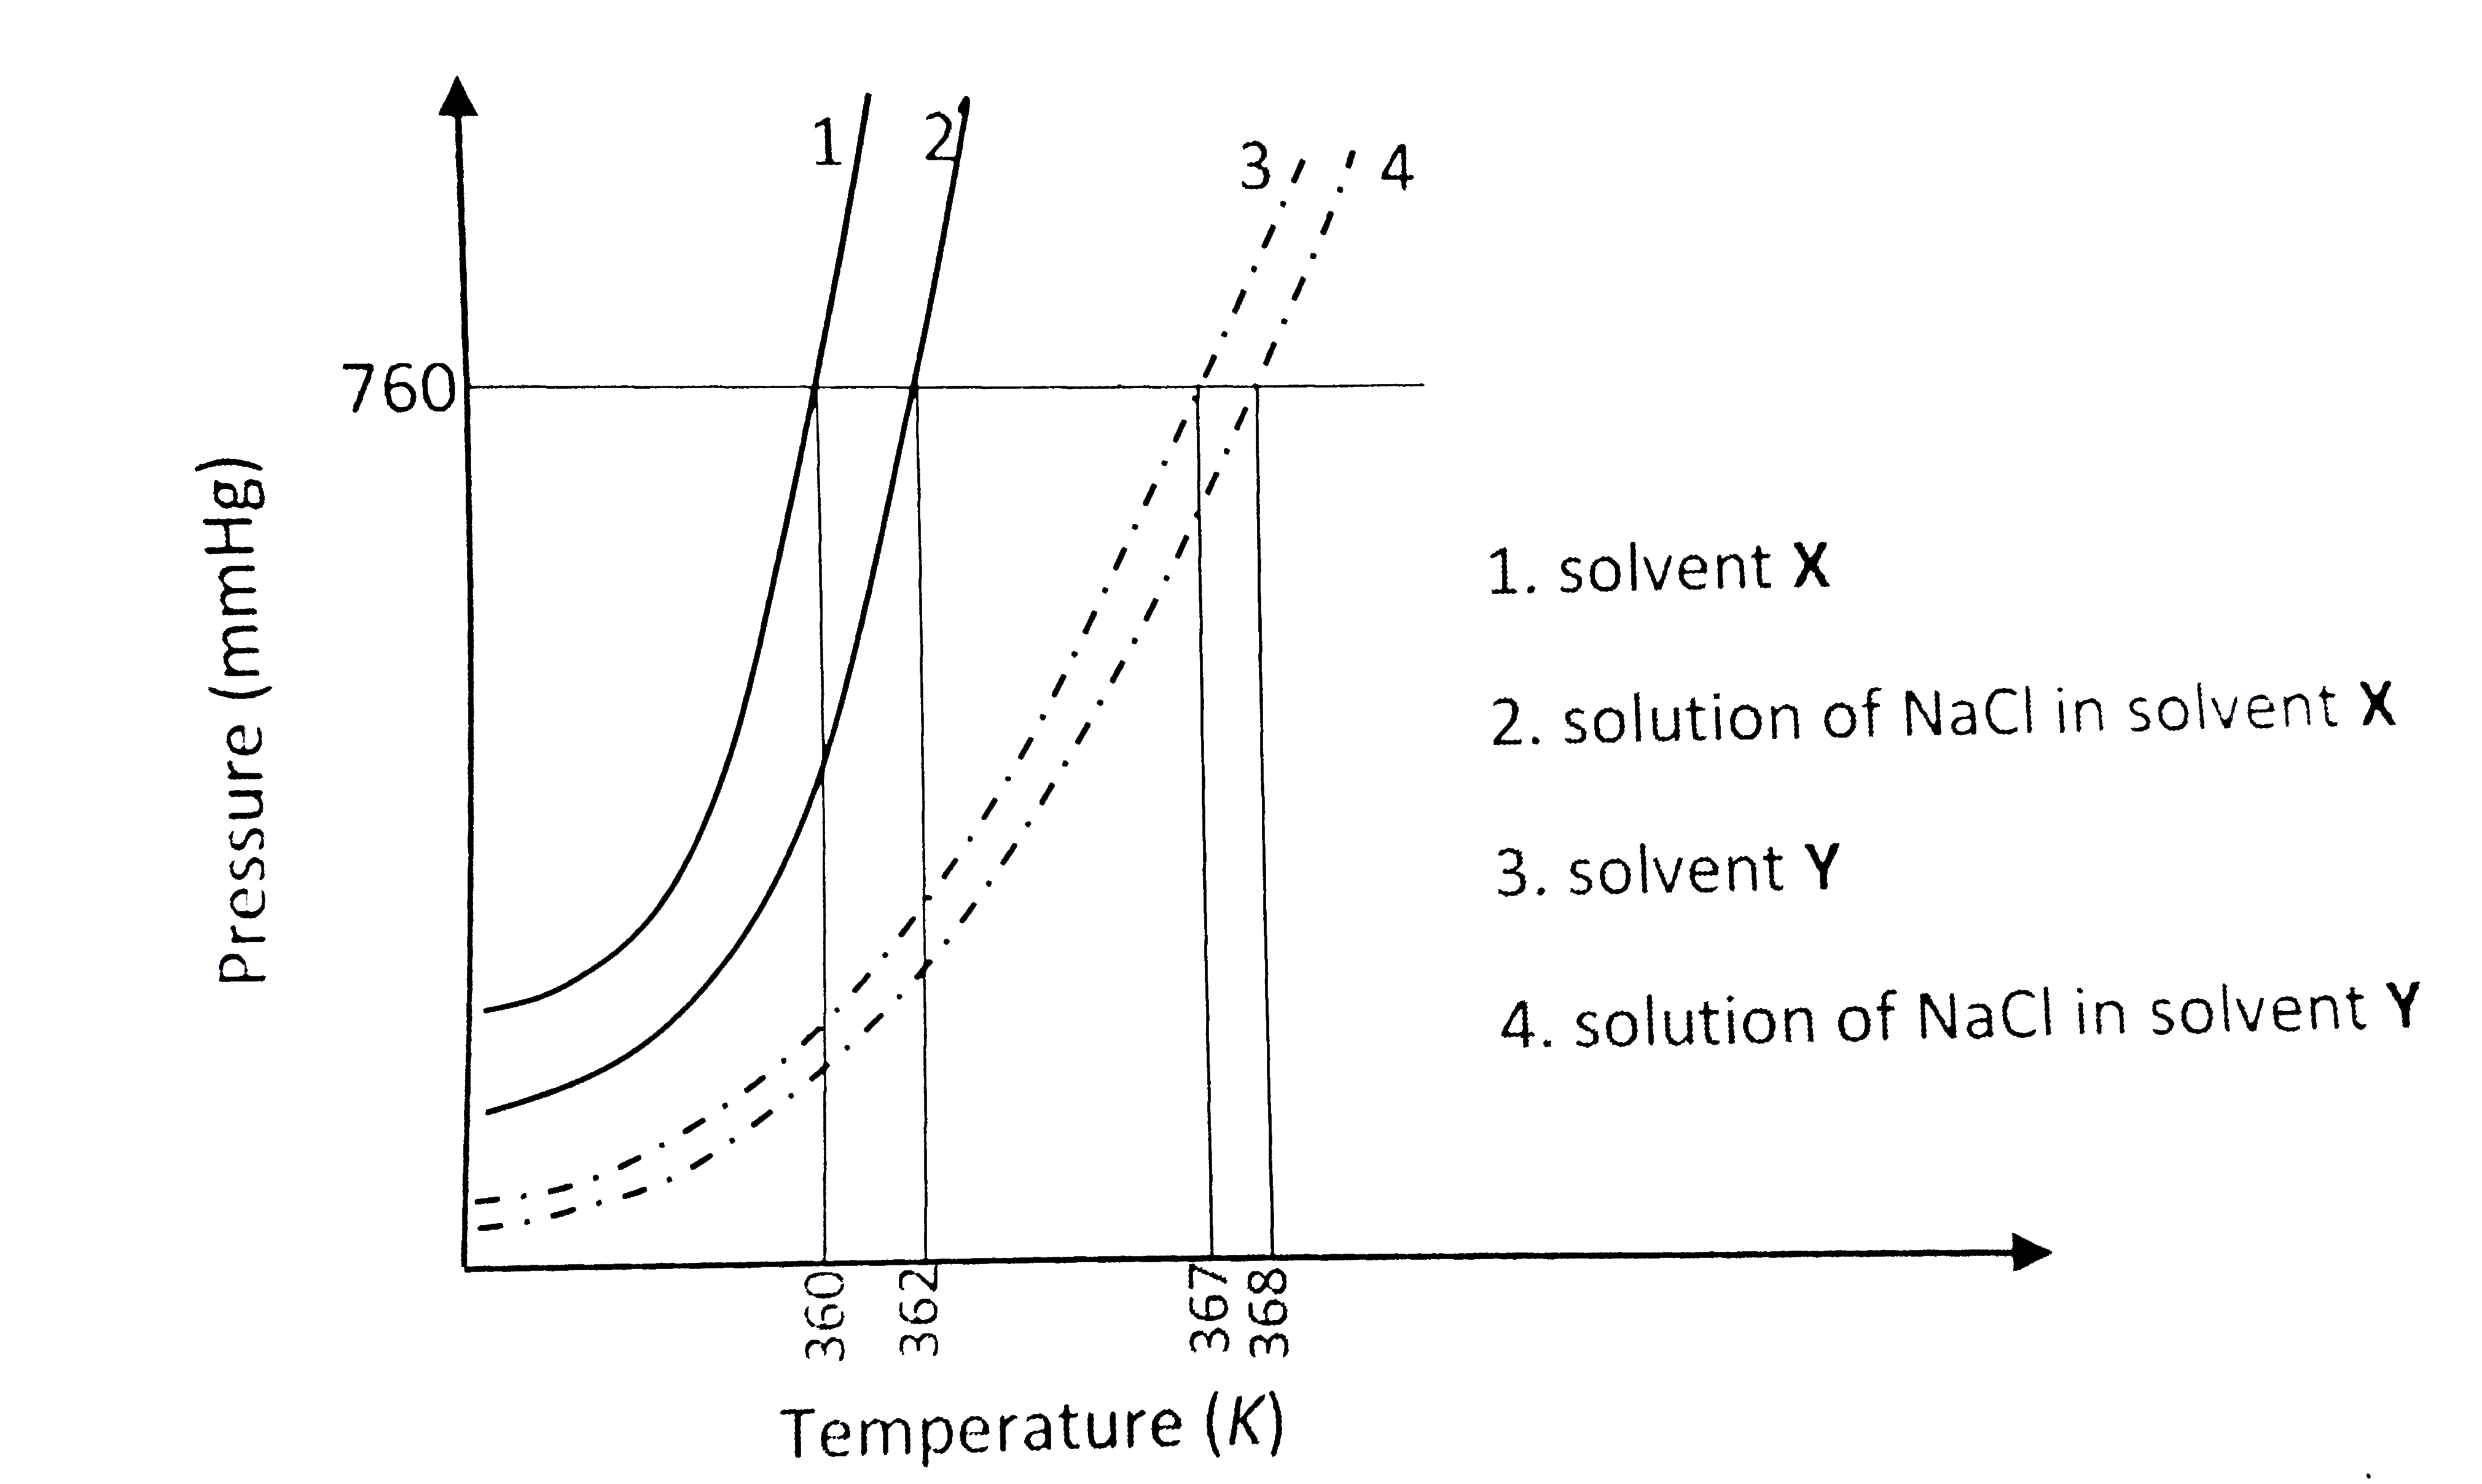
- The plot given below shows P -T curves (where P is the pressure and T ...
Text Solution
|
- The vapour pressure of a solution of a non-volatile electrolyte B in a...
Text Solution
|
- Vapour pressure of a solvent is the pressure exterted by vapour when t...
Text Solution
|
- If P^(@) the vapour pressure of a pure solvent and P is the vapour pre...
Text Solution
|
- The plot given below shows P -T curves (where P is the pressure and T ...
Text Solution
|
- Addition of a non-volatile solute in a volatile ideal solvent
Text Solution
|
- Addition of a non-volatile solute causes lowering in vapour pressure o...
Text Solution
|
- The vapour pressure of a solution of a non-volatile electrolyte B in a...
Text Solution
|
- नीचे दिया गया आरेख दो विलायकों X और Y तथा इन विलायकों में Nacl के सममो...
Text Solution
|