


Similar Questions
Explore conceptually related problems
Recommended Questions
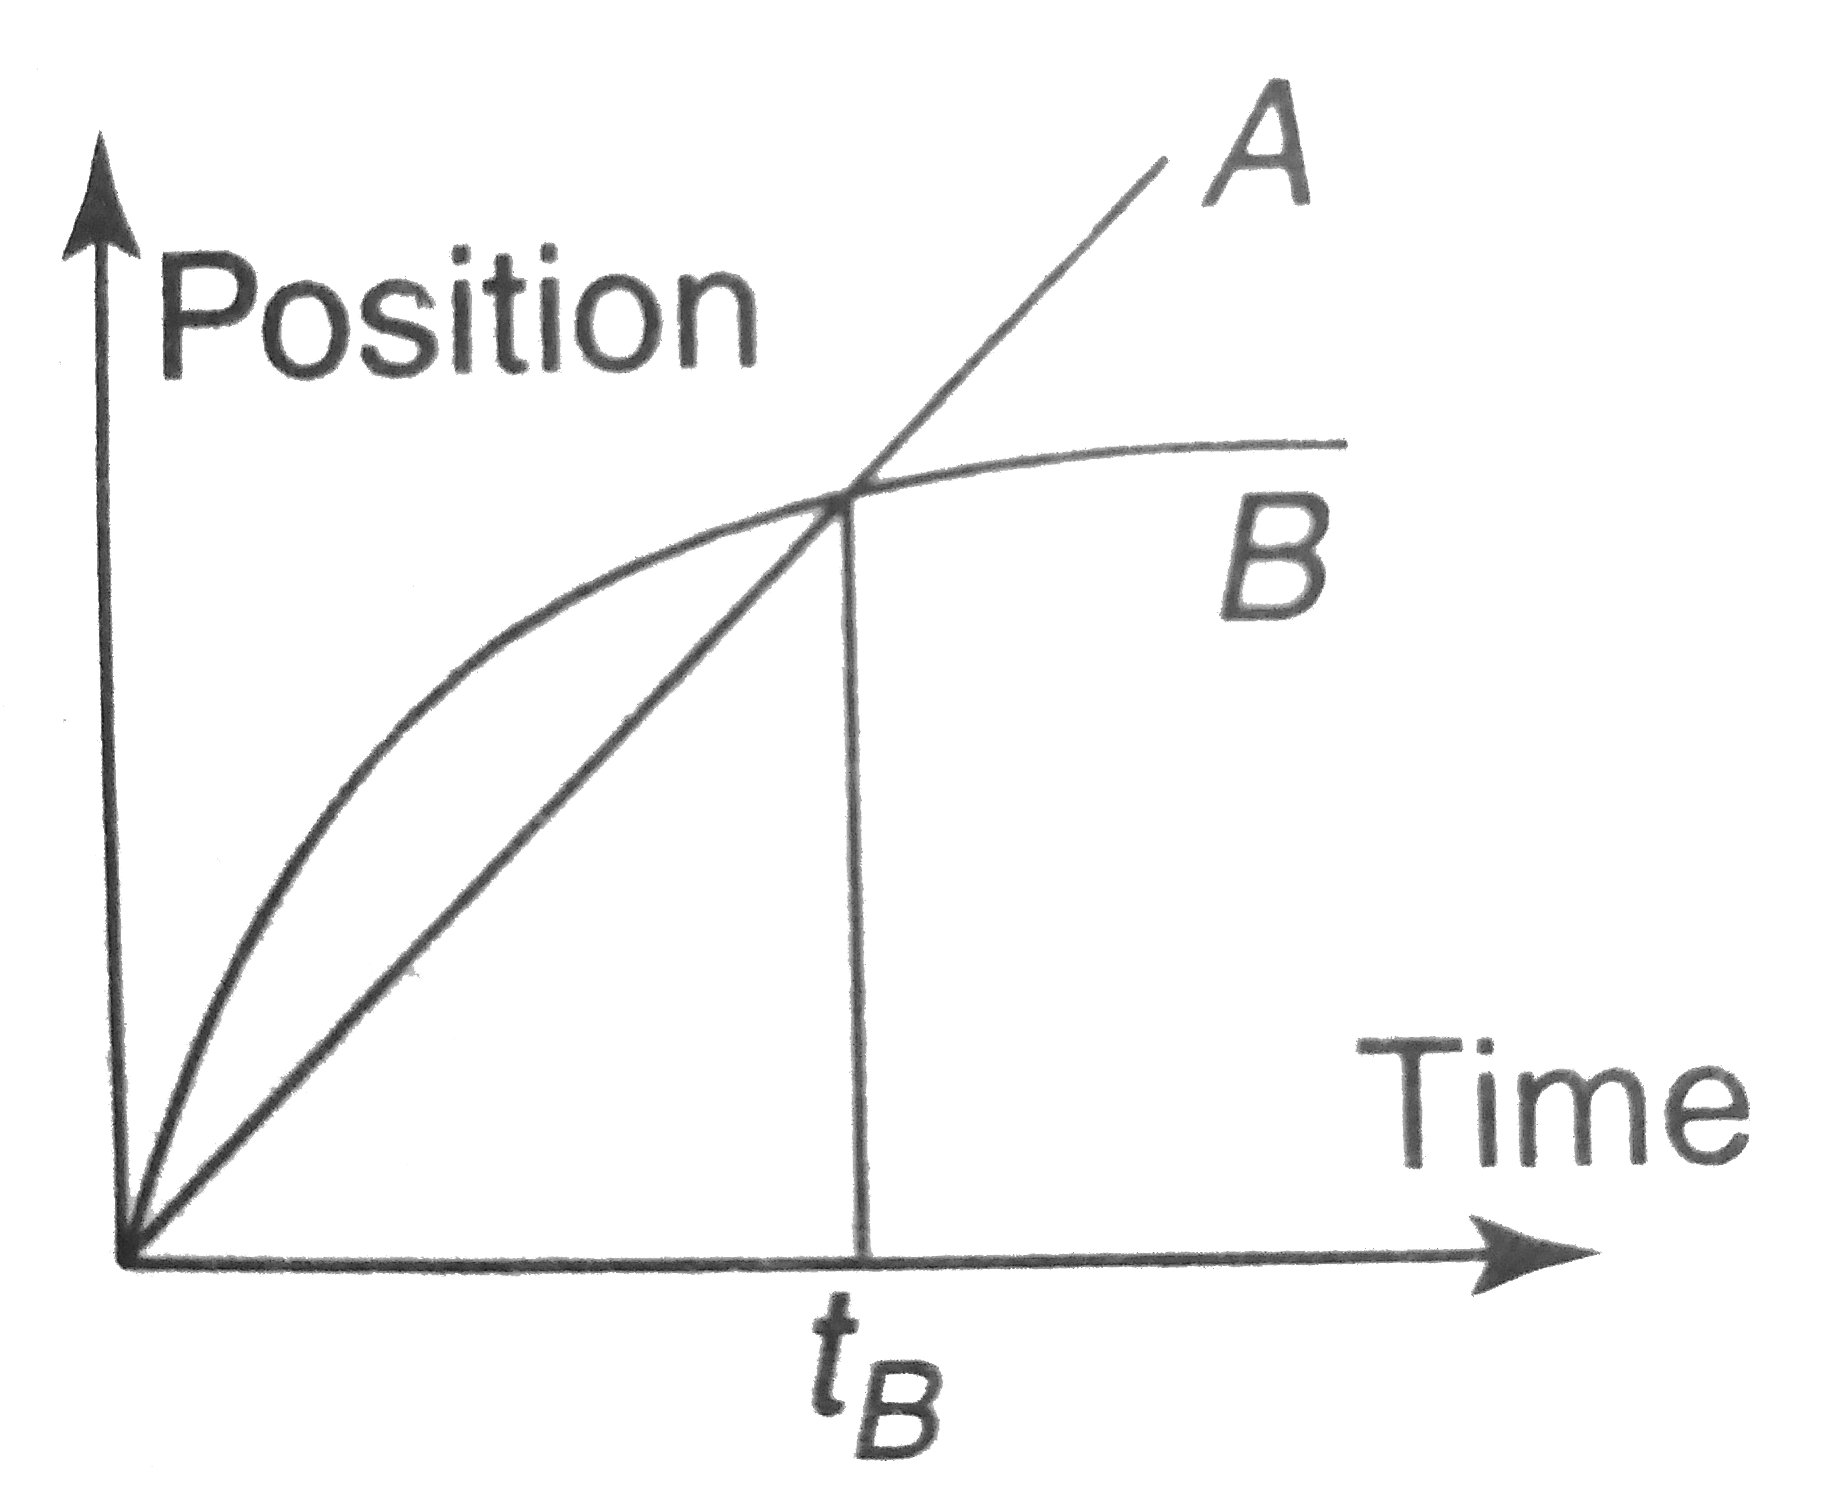
- The graph shows position as a function of time for two trains running ...
Text Solution
|
- Problems based on trains running on parallel track
Text Solution
|
- The plot shows the position (x) as a function of time (t) for two trai...
Text Solution
|
- The graph shows position as a function of time for two trains running ...
Text Solution
|
- The graph given shows the positions of two cars, A and B, as a functio...
Text Solution
|
- The graph given show the position of two cars A and B as a function of...
Text Solution
|
- The graph given show the position of two cars A and B as a function of...
Text Solution
|
- दो रेलगाड़ियाँ, जिनमें से प्रत्येक की लम्बाई 100 मीटर है , समान्तर पटरि...
Text Solution
|
- Two indentical trains are running in opposite directions over two trac...
Text Solution
|