


Similar Questions
Explore conceptually related problems
Recommended Questions
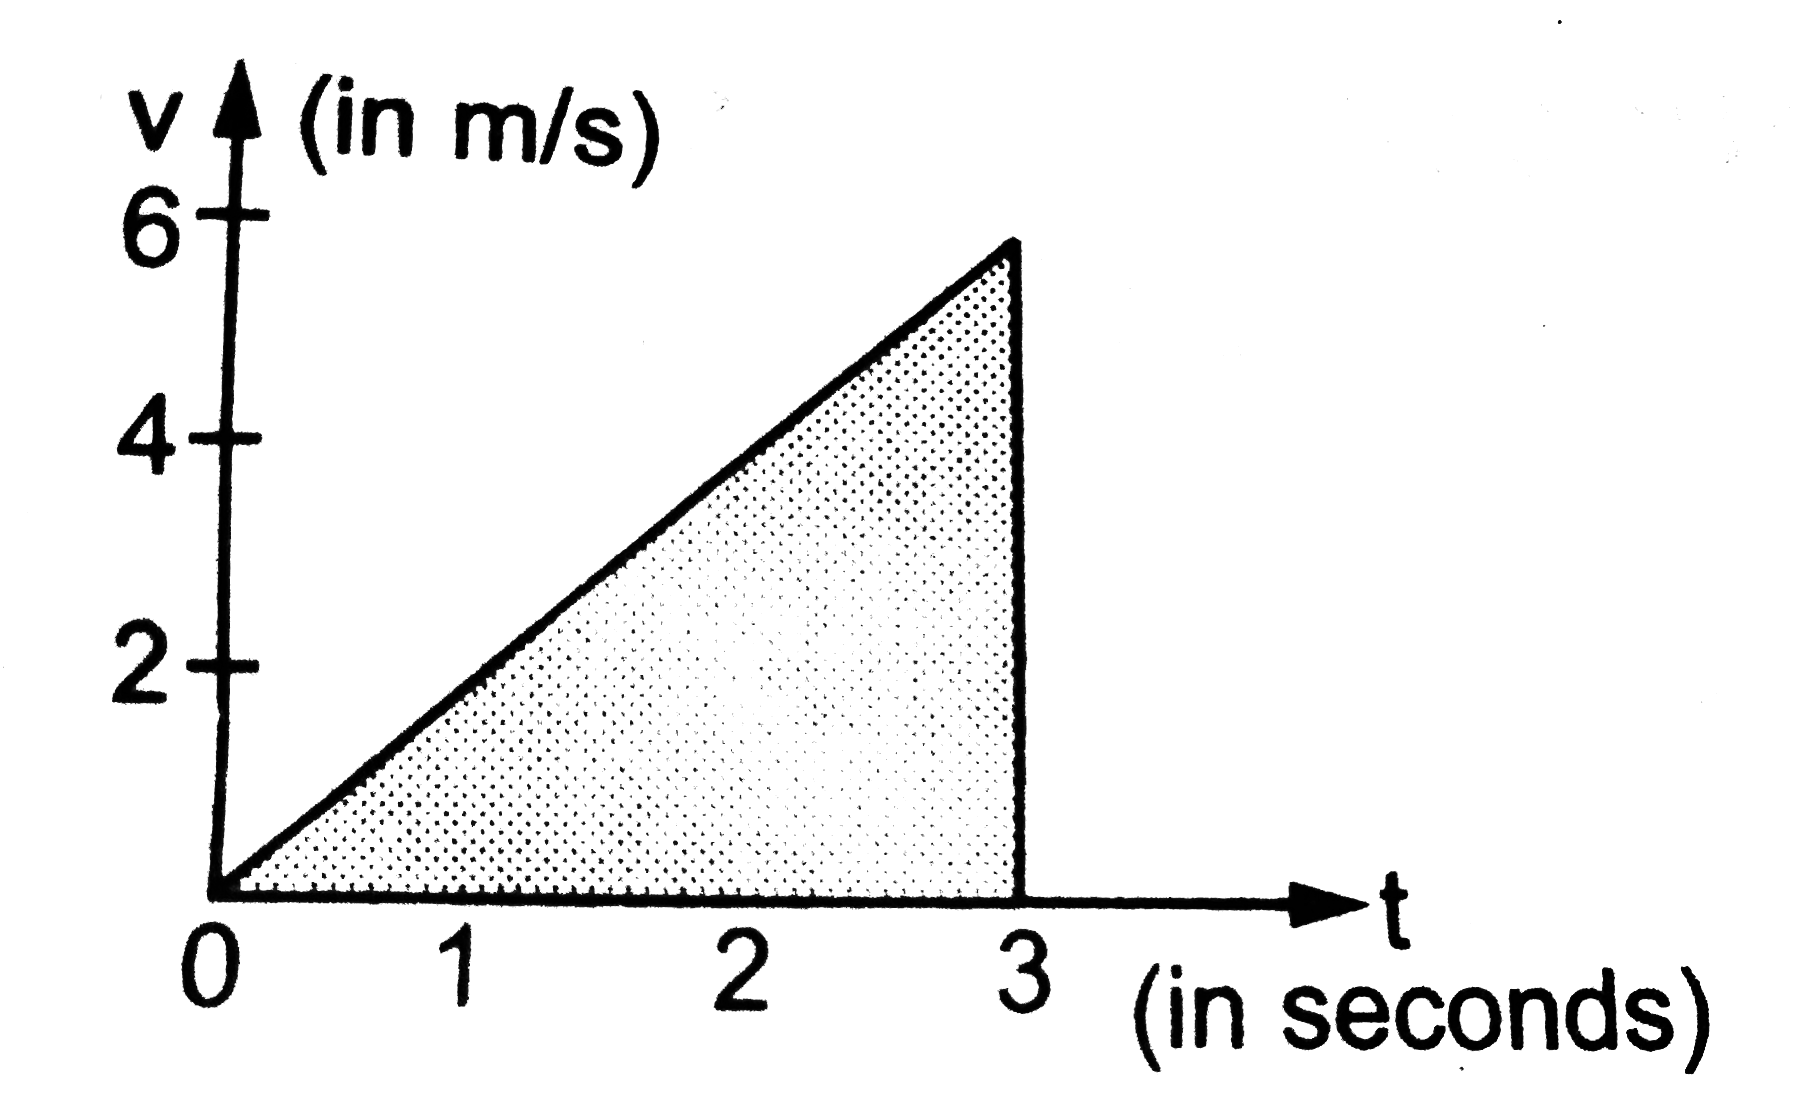
- Figure shows the speed versus time graph for a particle. Find the dist...
Text Solution
|
- The distance travelled by a particle in time t is given by s=(2.5m/s^2...
Text Solution
|
- Figure shows the speed versus time graph for a particle. Find the dist...
Text Solution
|
- Figure shows x-t graph of a particle. Find the Time T Such that the Av...
Text Solution
|
- A graph of acceleration versus time of a particle starting from rest a...
Text Solution
|
- Find the distance travelled by the particle during the time t = 0 to t...
Text Solution
|
- The speed verses time graph for a particle is shown in the figure. The...
Text Solution
|
- The distance travelled by a particle in time t is given by s=(2.5)t^(2...
Text Solution
|
- The distance travelled by a particle in time t is given by s=(2.5m/s^2...
Text Solution
|