Text Solution
Verified by Experts
The correct Answer is:


Topper's Solved these Questions
MISCELLANEOUS
ALLEN|Exercise Part -II Example|61 VideosMISCELLANEOUS
ALLEN|Exercise Part -II Example Some worked out Examples|1 VideosKINEMATICS (MOTION ALONG A STRAIGHT LINE AND MOTION IN A PLANE)
ALLEN|Exercise BEGINNER S BOX-7|8 VideosPHYSICAL WORLD, UNITS AND DIMENSIONS & ERRORS IN MEASUREMENT
ALLEN|Exercise EXERCISE-IV|8 Videos
Similar Questions
Explore conceptually related problems
ALLEN-MISCELLANEOUS-SUBJECTIVE QUESTION
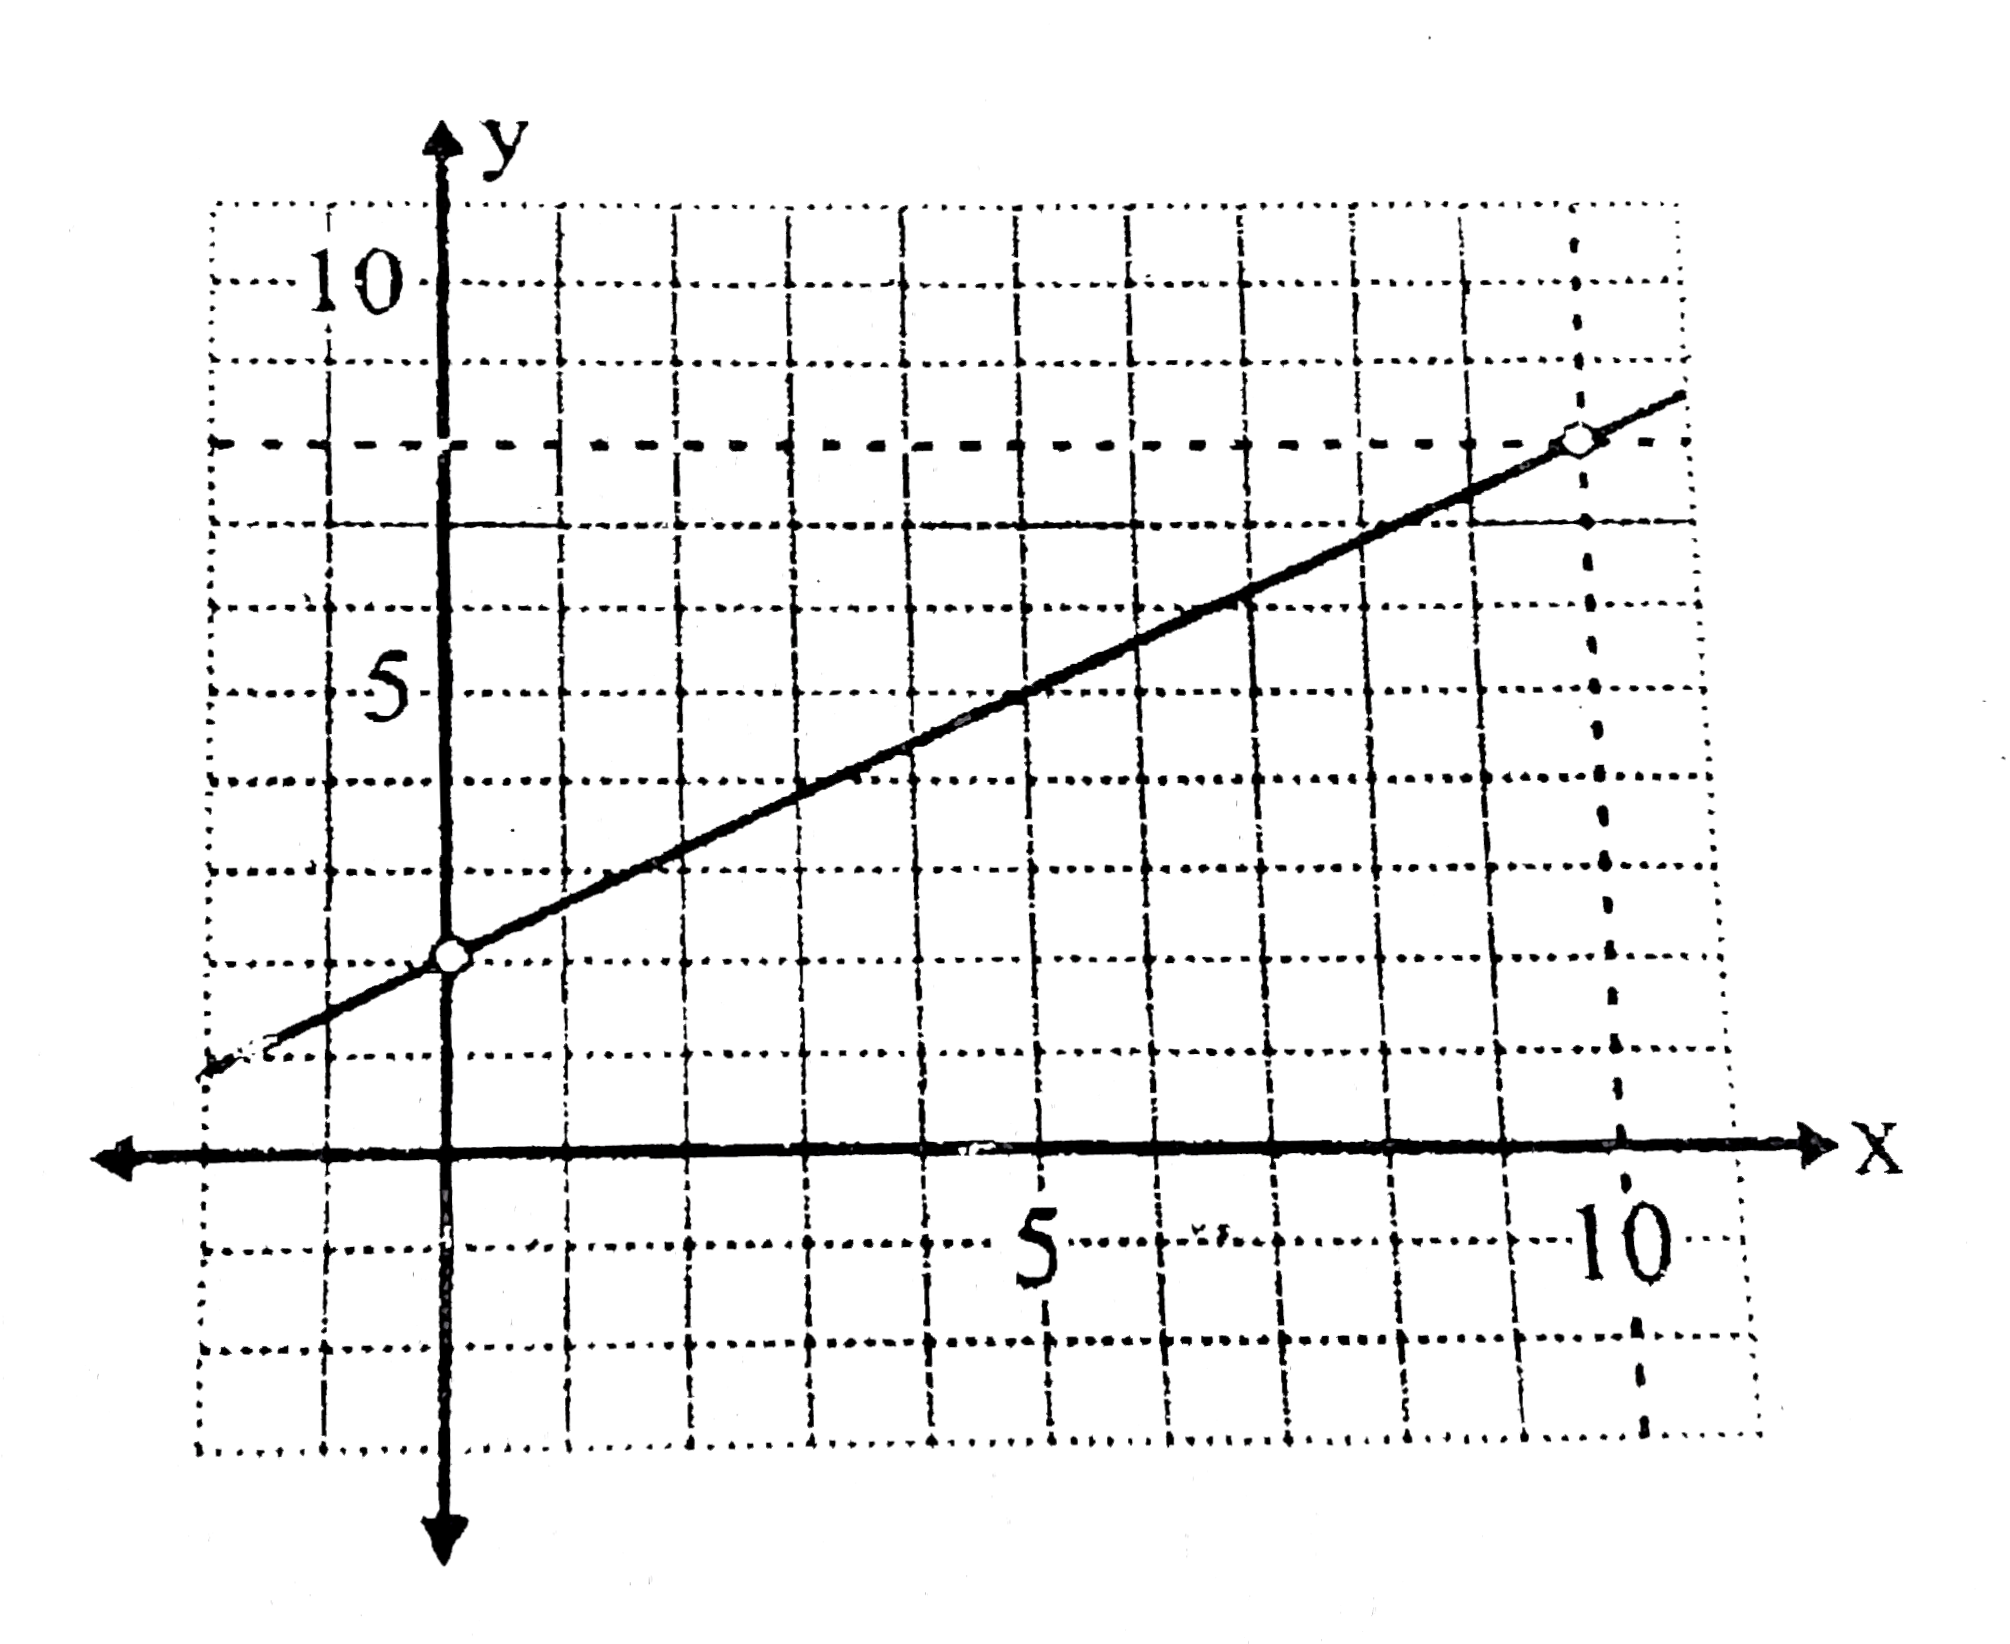
- A variable y increases from y(1)=2 to y(2)=8 linearly with another var...
Text Solution
|
- A conducting sphere S1 of radius r is attached to an insulating handle...
Text Solution
|
- A non-conducting disc of radius a and uniform positive surface charge ...
Text Solution
|
- Four point charges +8muC,-1muC,-1muC and , +8muC are fixed at the poin...
Text Solution
|
- A small ball if mass 2 xx 10^(-3) Kg having a charges of 1 mu C is su...
Text Solution
|
- Charges +q and -q are located at the corners of a cube of side as show...
Text Solution
|
- A charge +Q is fixed at the origin of the co-ordinate system while a s...
Text Solution
|
- There are two large parallel metallic plates S(1) and S(2) carrying su...
Text Solution
|
- A conducting liquid bubble of radius a and thickness t ( tltlt a) is ...
Text Solution
|
- A solid sphere of radius R has a charge Q distributed in its volume wi...
Text Solution
|