


Similar Questions
Explore conceptually related problems
Recommended Questions
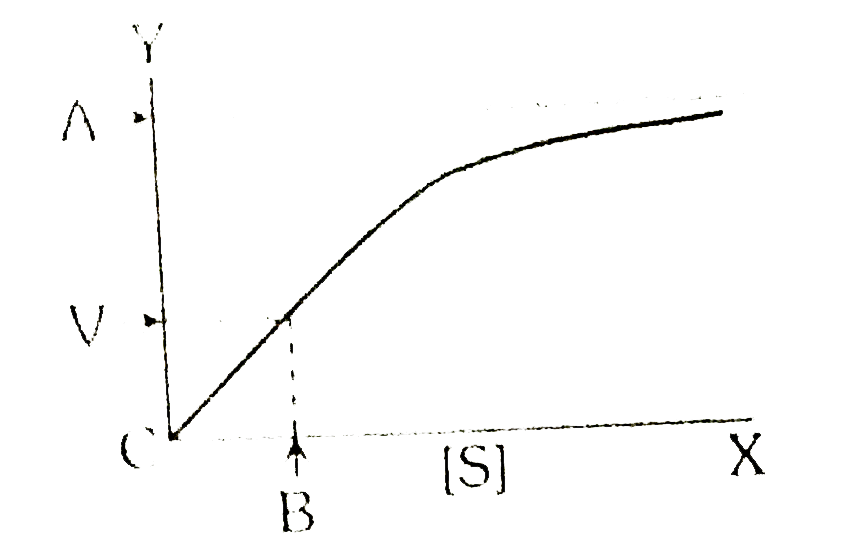
- The given adjacent graph depicts the change in conc. of substrate on e...
Text Solution
|
- Arrange the steps of catalytic action of an enzyme in order an choose ...
Text Solution
|
- The given adjacent graph depicts the change in conc. of substrate on e...
Text Solution
|
- Assertion : Specific substrate binds at the active site of the ...
Text Solution
|
- दिए गए ग्राफ (a) व (b) में आवृत्ति के सापेक्ष परिपथ की धारा के विरोध क...
Text Solution
|
- Following graphs show the effect of change in concentration of substra...
Text Solution
|
- The following graph represents enzyme activity with changing
Text Solution
|
- What is denoted by X and Y in the given graph? {:("X","Y"),("1) ...
Text Solution
|
- Observe the given graph a and b. Does the substrate concentration infl...
Text Solution
|