


Similar Questions
Explore conceptually related problems
Recommended Questions
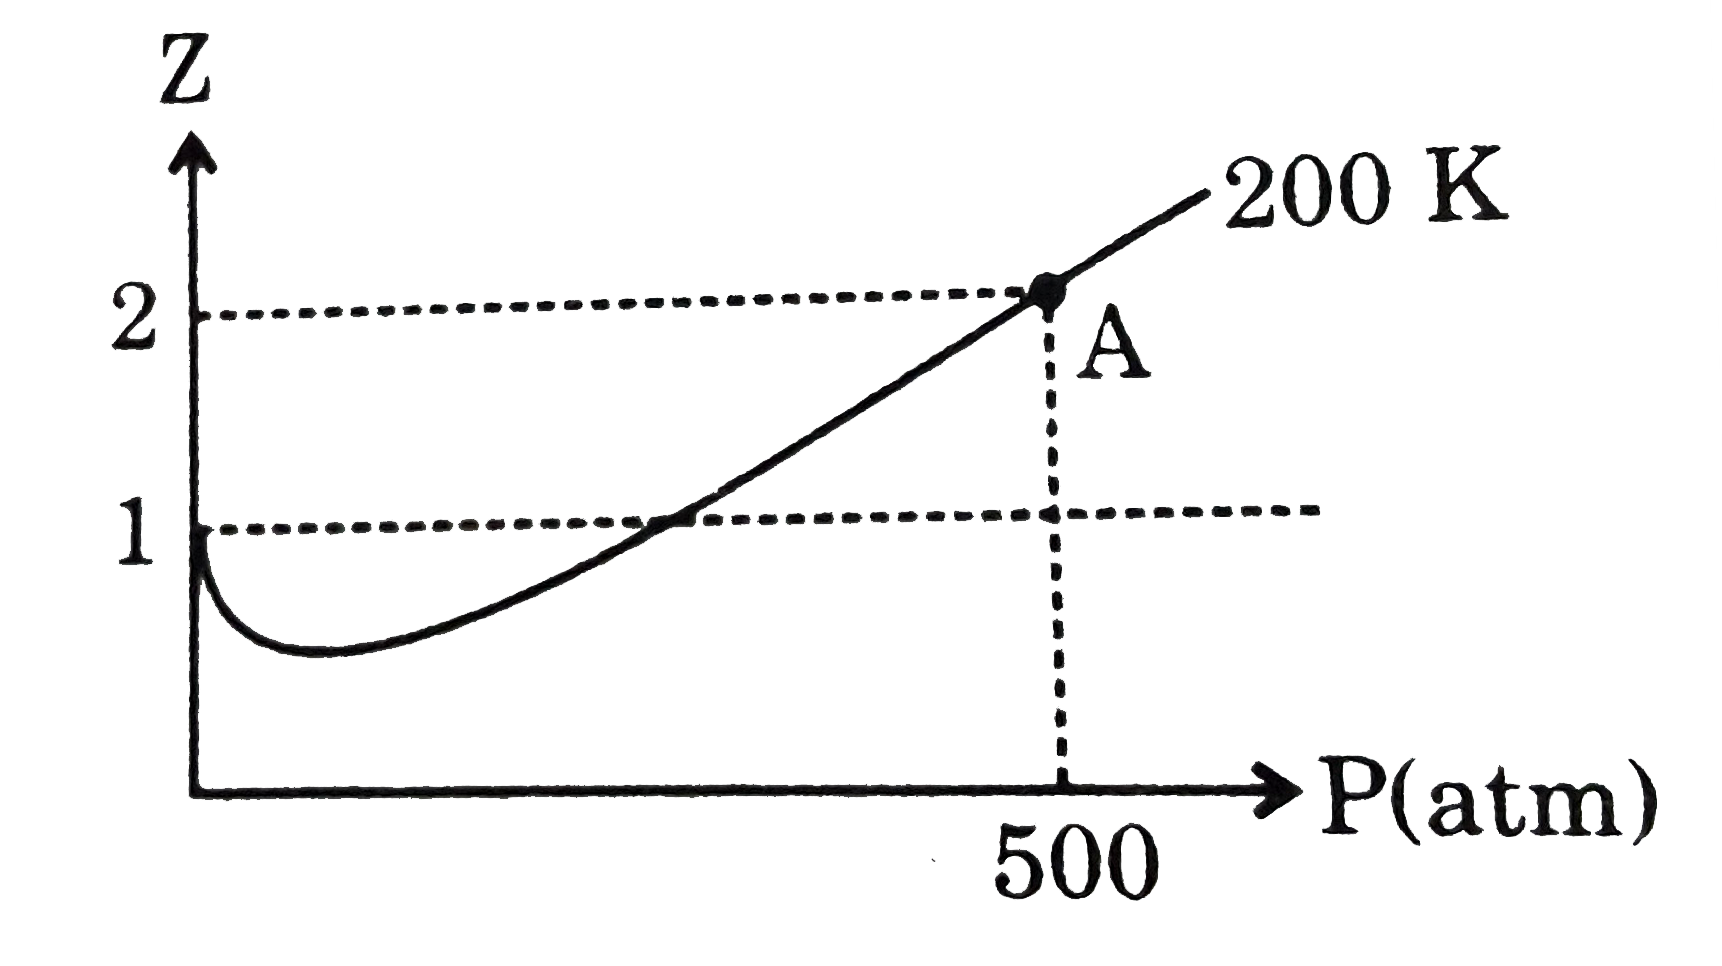
- Z us P graph is plotted for 1 mole of hypothetical gas. Volume of gas ...
Text Solution
|
- Calculate the moles of an ideal gas at pressure 2 atm and volume 1 L a...
Text Solution
|
- The volume of 10 "moles" of an ideal gas at 10 atm and 500 K is
Text Solution
|
- CH(4) gas is behaving non-ideally. Compressibility factor for gas is 1...
Text Solution
|
- The third virial coefficient of He gas is 4xx10^(-2)(L//"mol")^(2) , t...
Text Solution
|
- 80 gm of SO(x) gas occupies 15 litre at 2atm and 300K. The value of x ...
Text Solution
|
- One mole of an ideal gas at 27^(@) ,8.21 atm absorbs 420 cal of heat d...
Text Solution
|
- P vs V graph is plotted for 1 mole of hypothetical gas. Range of a/b f...
Text Solution
|
- Consider the given graph: Graph is plotted for 1 mol of gas at 400K, f...
Text Solution
|