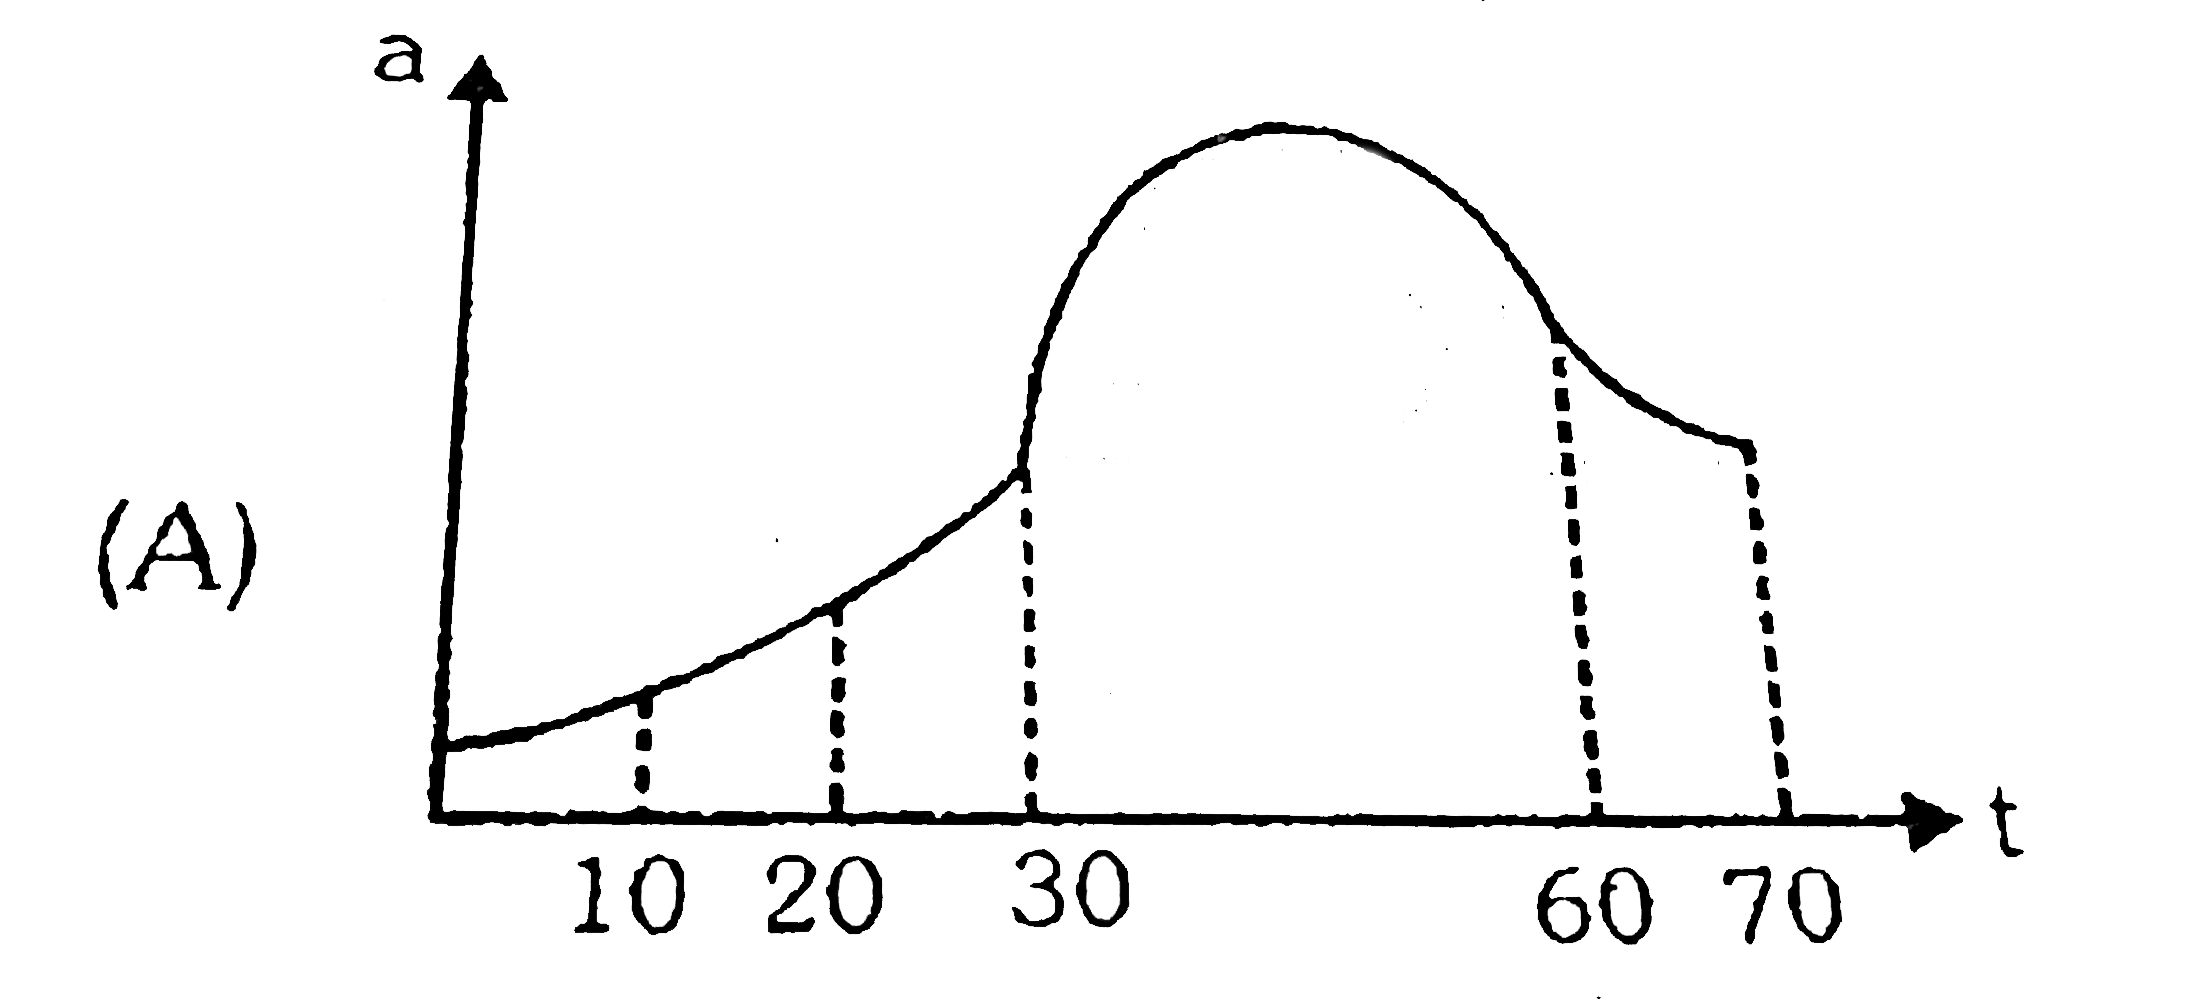
A
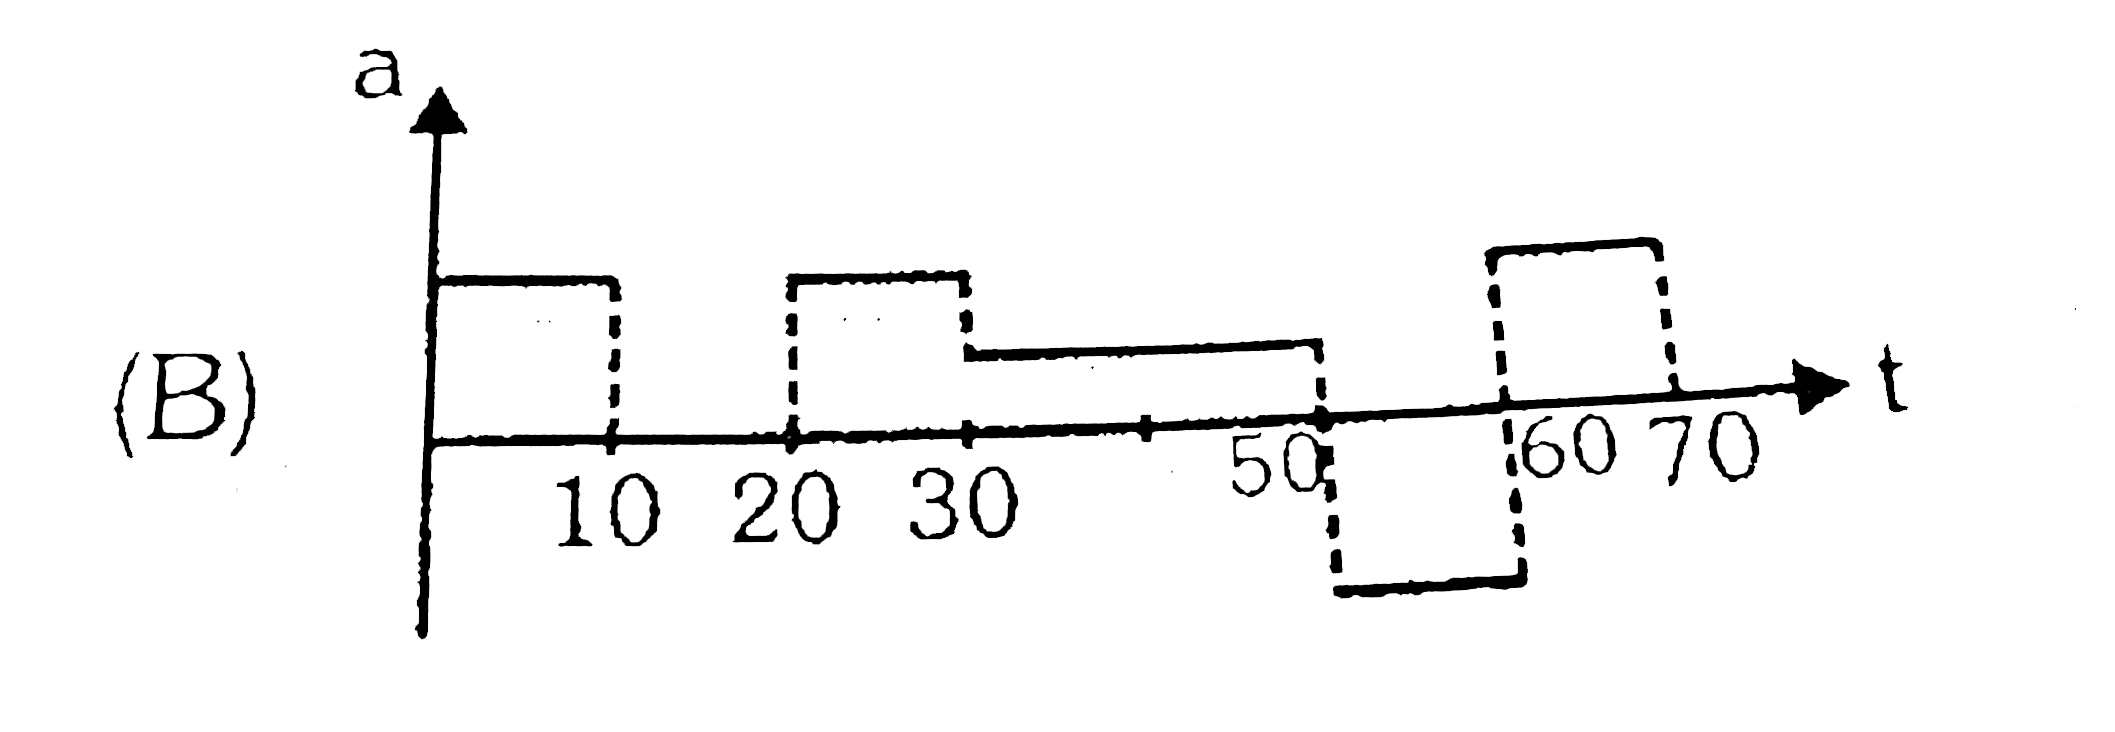
B
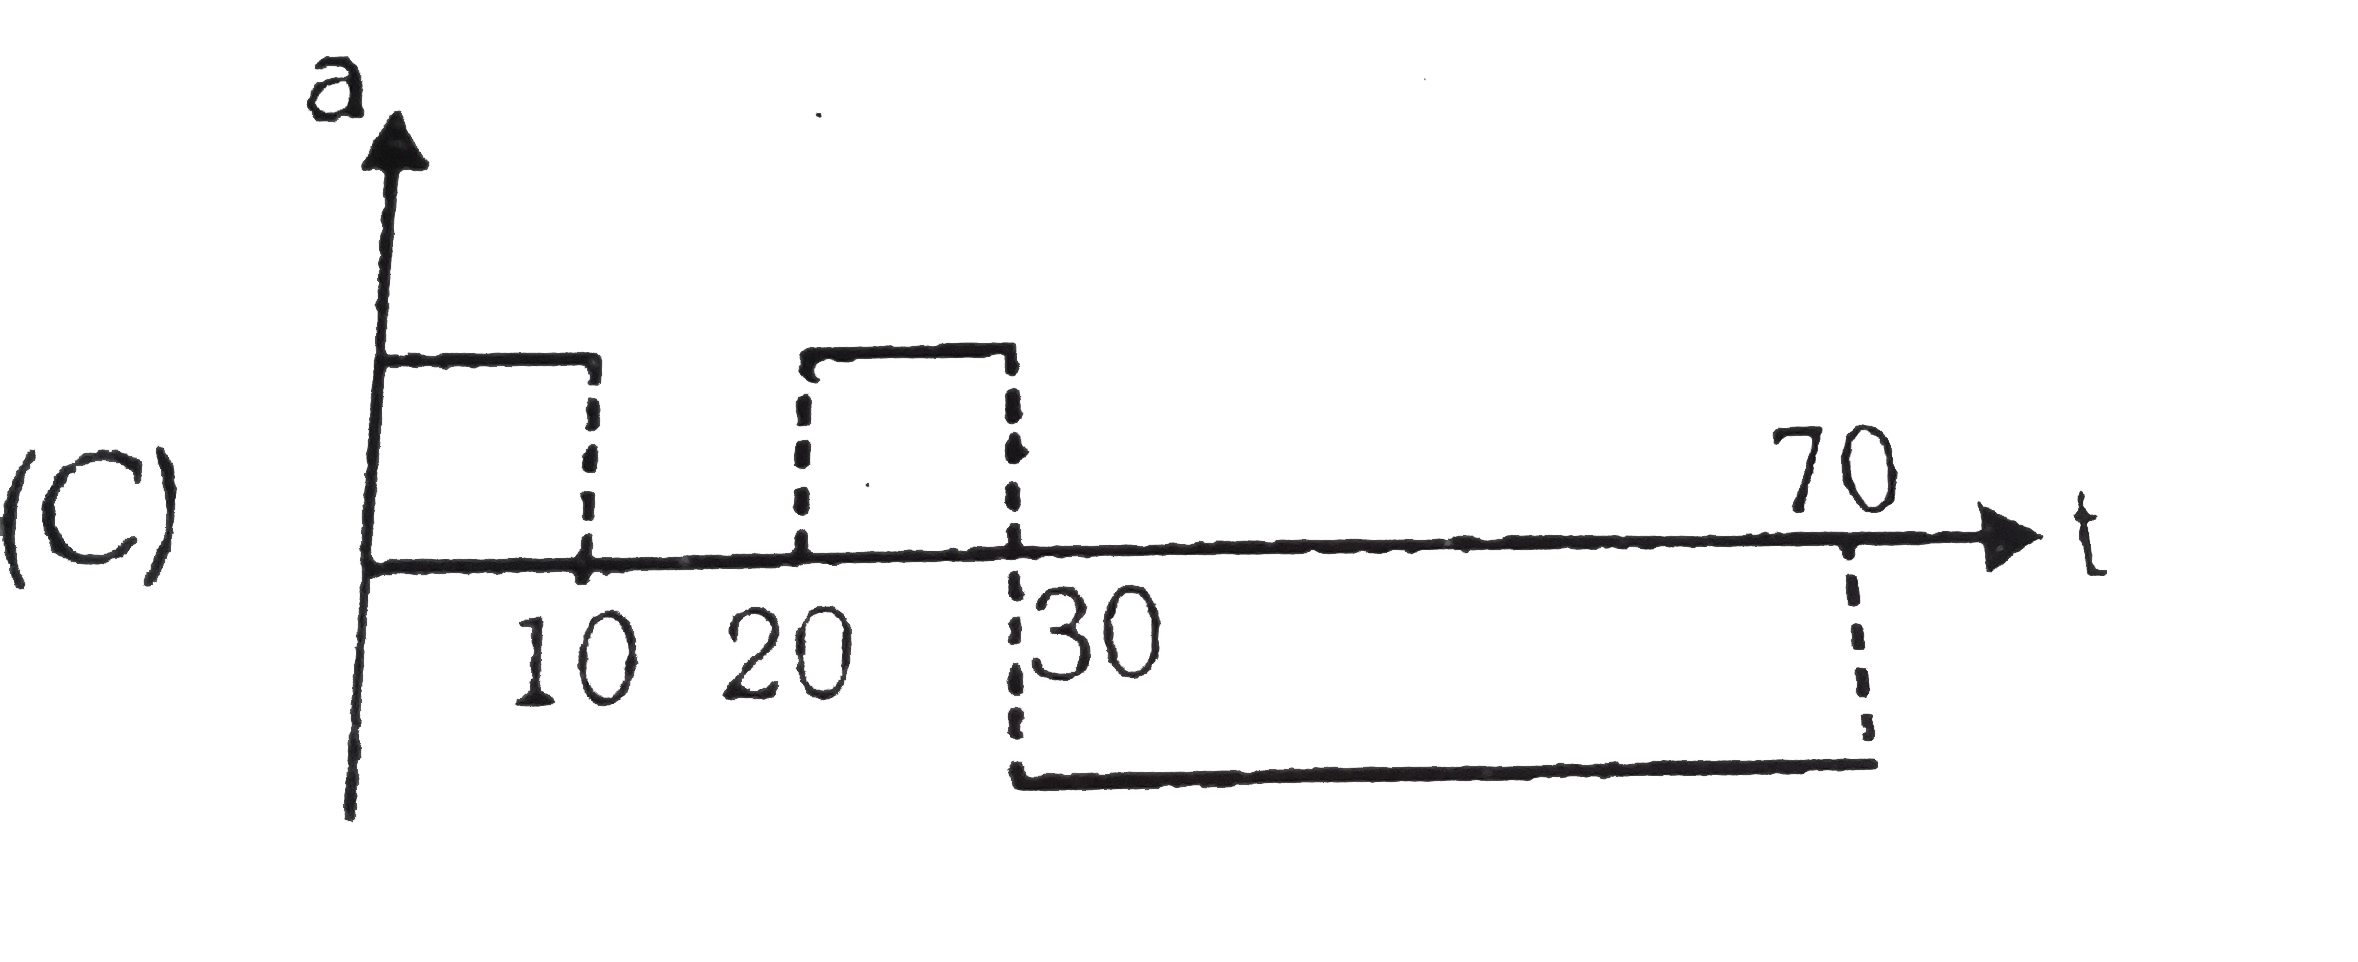
C
D

Text Solution
Verified by Experts
The correct Answer is:


Topper's Solved these Questions
KINEMATICS
ALLEN|Exercise Comprehension#3|5 VideosKINEMATICS
ALLEN|Exercise Comprehension#4|3 VideosKINEMATICS
ALLEN|Exercise Comprehension#1|3 VideosERROR AND MEASUREMENT
ALLEN|Exercise Part-2(Exercise-2)(B)|22 VideosKINEMATICS (MOTION ALONG A STRAIGHT LINE AND MOTION IN A PLANE)
ALLEN|Exercise BEGINNER S BOX-7|8 Videos
Similar Questions
Explore conceptually related problems
ALLEN-KINEMATICS-Comprehension#2
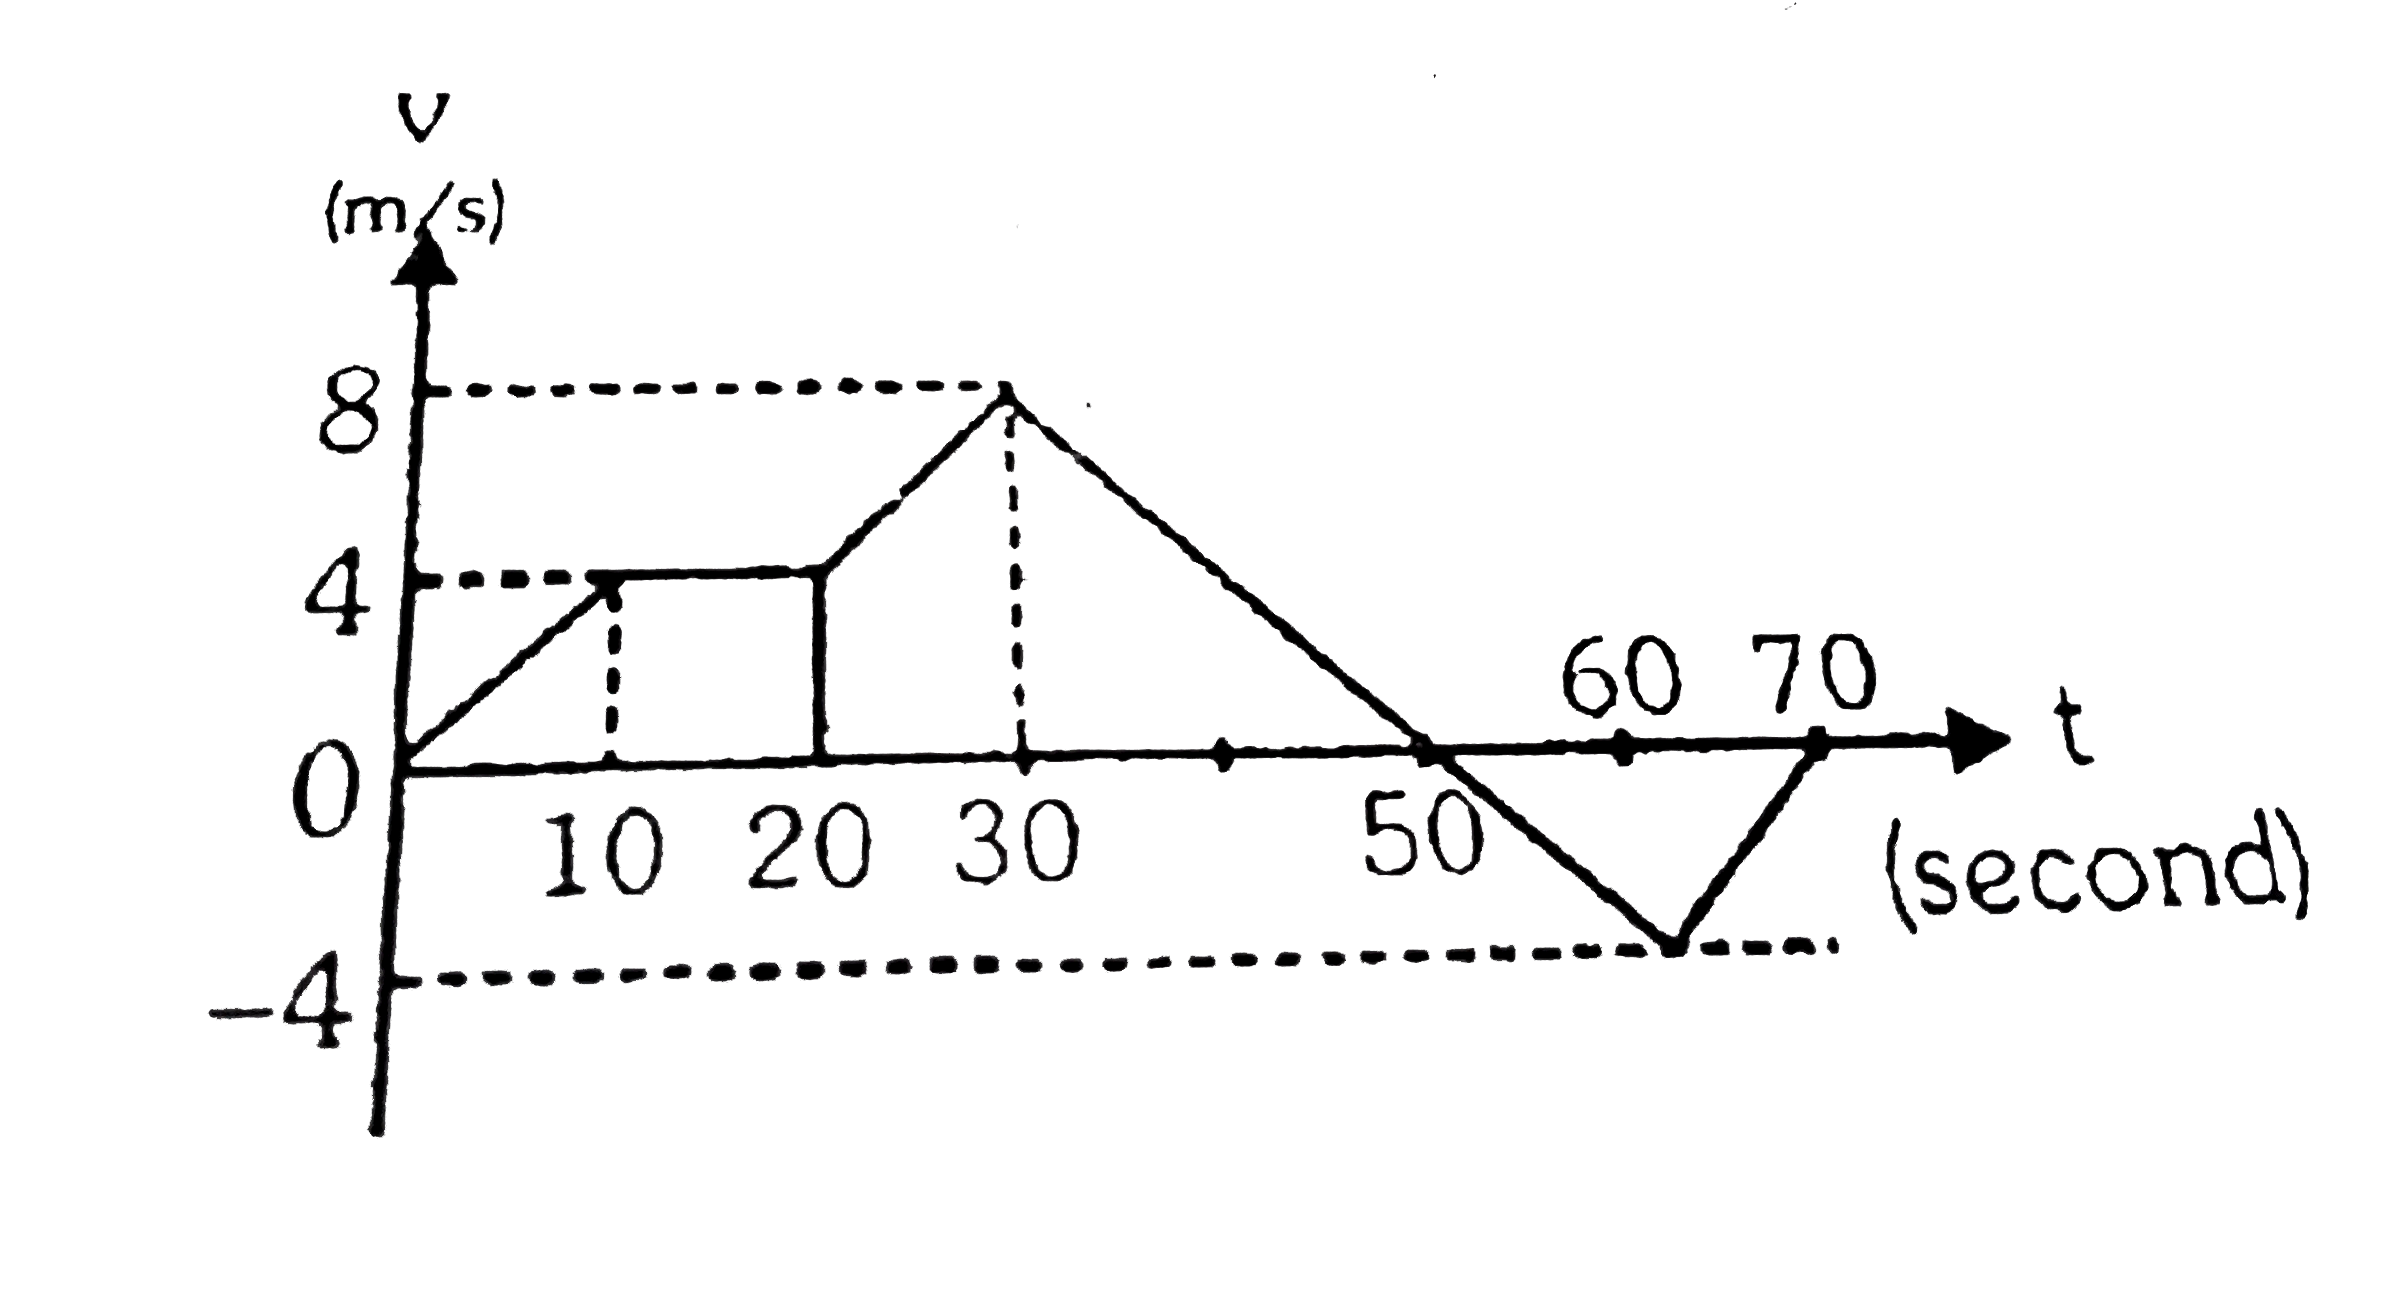
- A car is moving on a straight road. The velocity of the car varies wit...
Text Solution
|
- A car is moving on a straight road. The velocity of the car varies wit...
Text Solution
|
- A car is moving on a straight road. The velocity of the car varies wit...
Text Solution
|
- A car is moving on a straight road. The velocity of the car varies wit...
Text Solution
|
- A car is moving on a straight road. The velocity of the car varies wit...
Text Solution
|