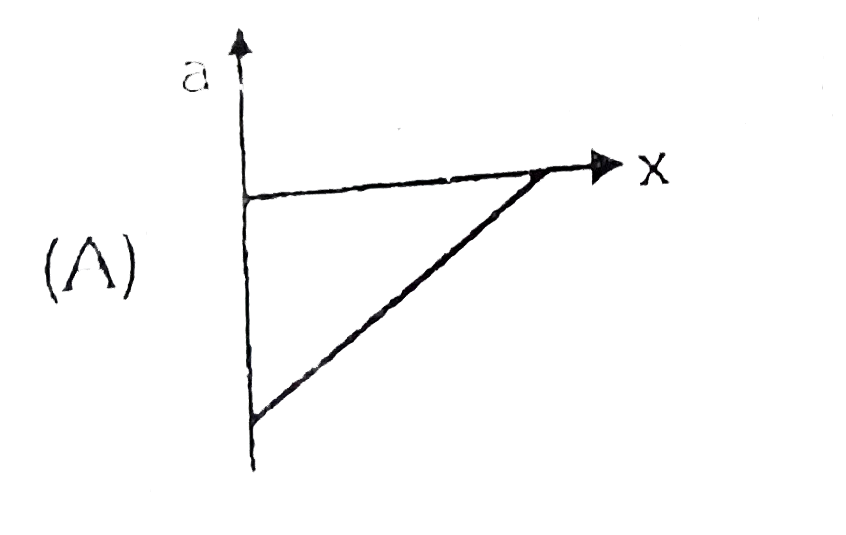
A
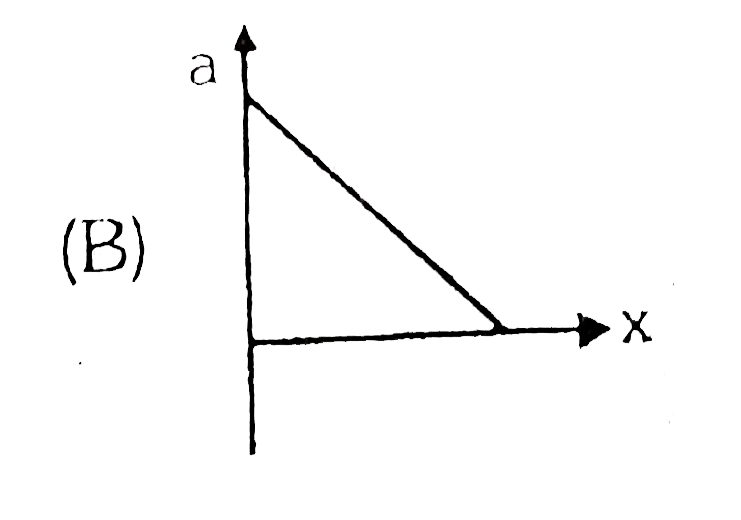
B
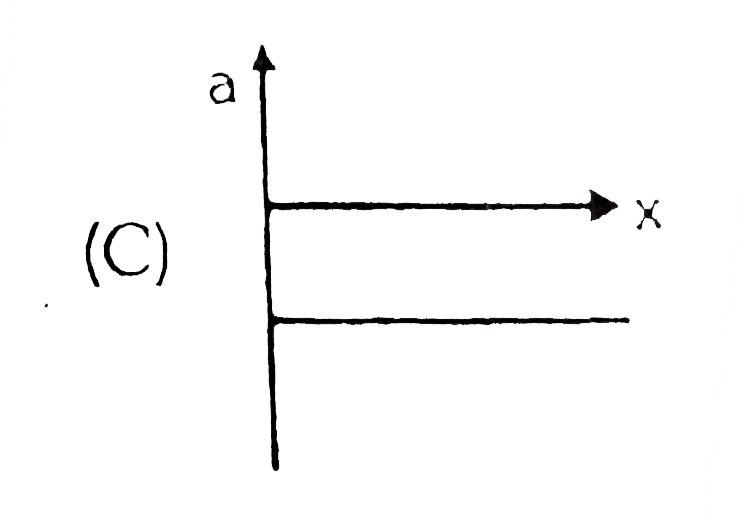
C
D
Text Solution
Verified by Experts
The correct Answer is:


Topper's Solved these Questions
KINEMATICS
ALLEN|Exercise MCQ with one or more than one correct Question|1 VideosKINEMATICS
ALLEN|Exercise SUBJECTIVE QUESTION|3 VideosKINEMATICS
ALLEN|Exercise Exercise-05 [A]|11 VideosERROR AND MEASUREMENT
ALLEN|Exercise Part-2(Exercise-2)(B)|22 VideosKINEMATICS (MOTION ALONG A STRAIGHT LINE AND MOTION IN A PLANE)
ALLEN|Exercise BEGINNER S BOX-7|8 Videos
Similar Questions
Explore conceptually related problems
ALLEN-KINEMATICS-Exercise-05[B]
- In 1.0 s, a particle goes from point A to point B , moving in a semici...
Text Solution
|
- A ball is dropped vertically from a height d above the ground . It hit...
Text Solution
|
- A particle starting from rest. Its acceleration (a) versus time (t) is...
Text Solution
|
- A particle starts sliding down a frictionless inclined plane. If S(n...
Text Solution
|
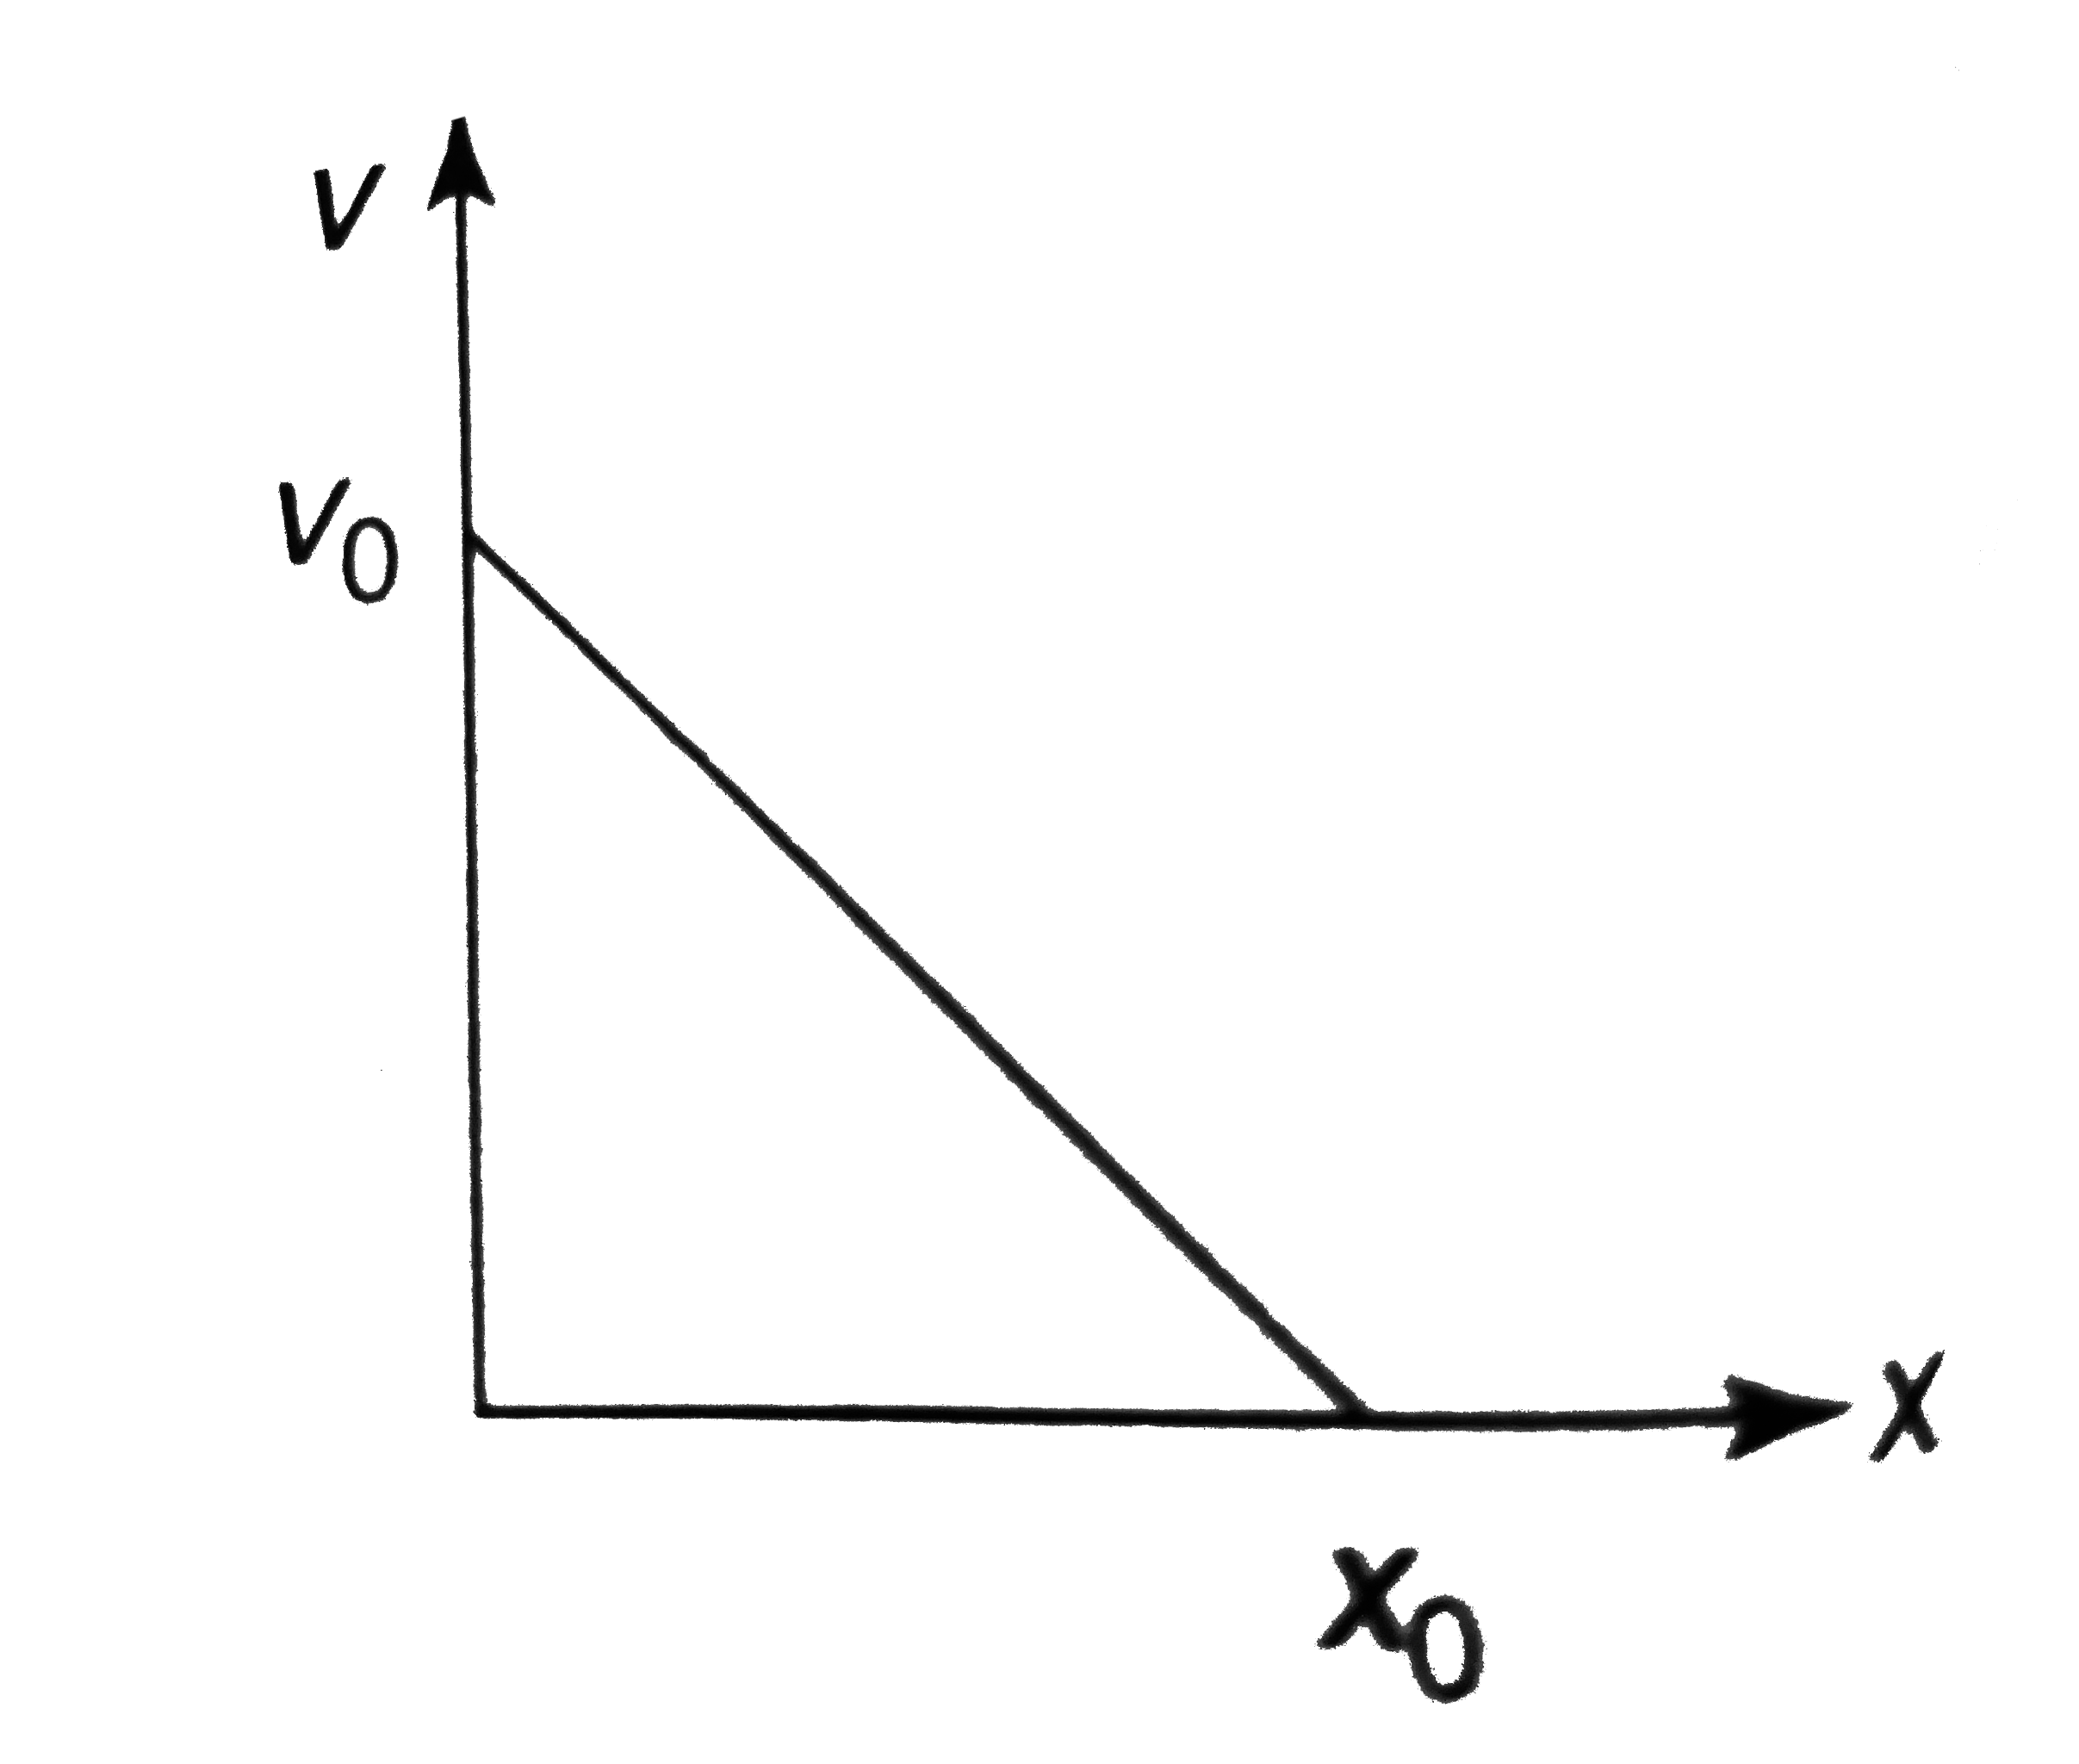
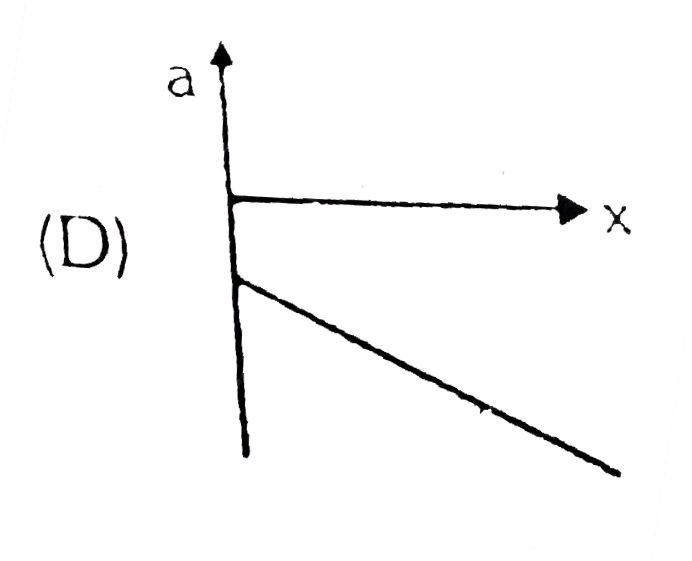
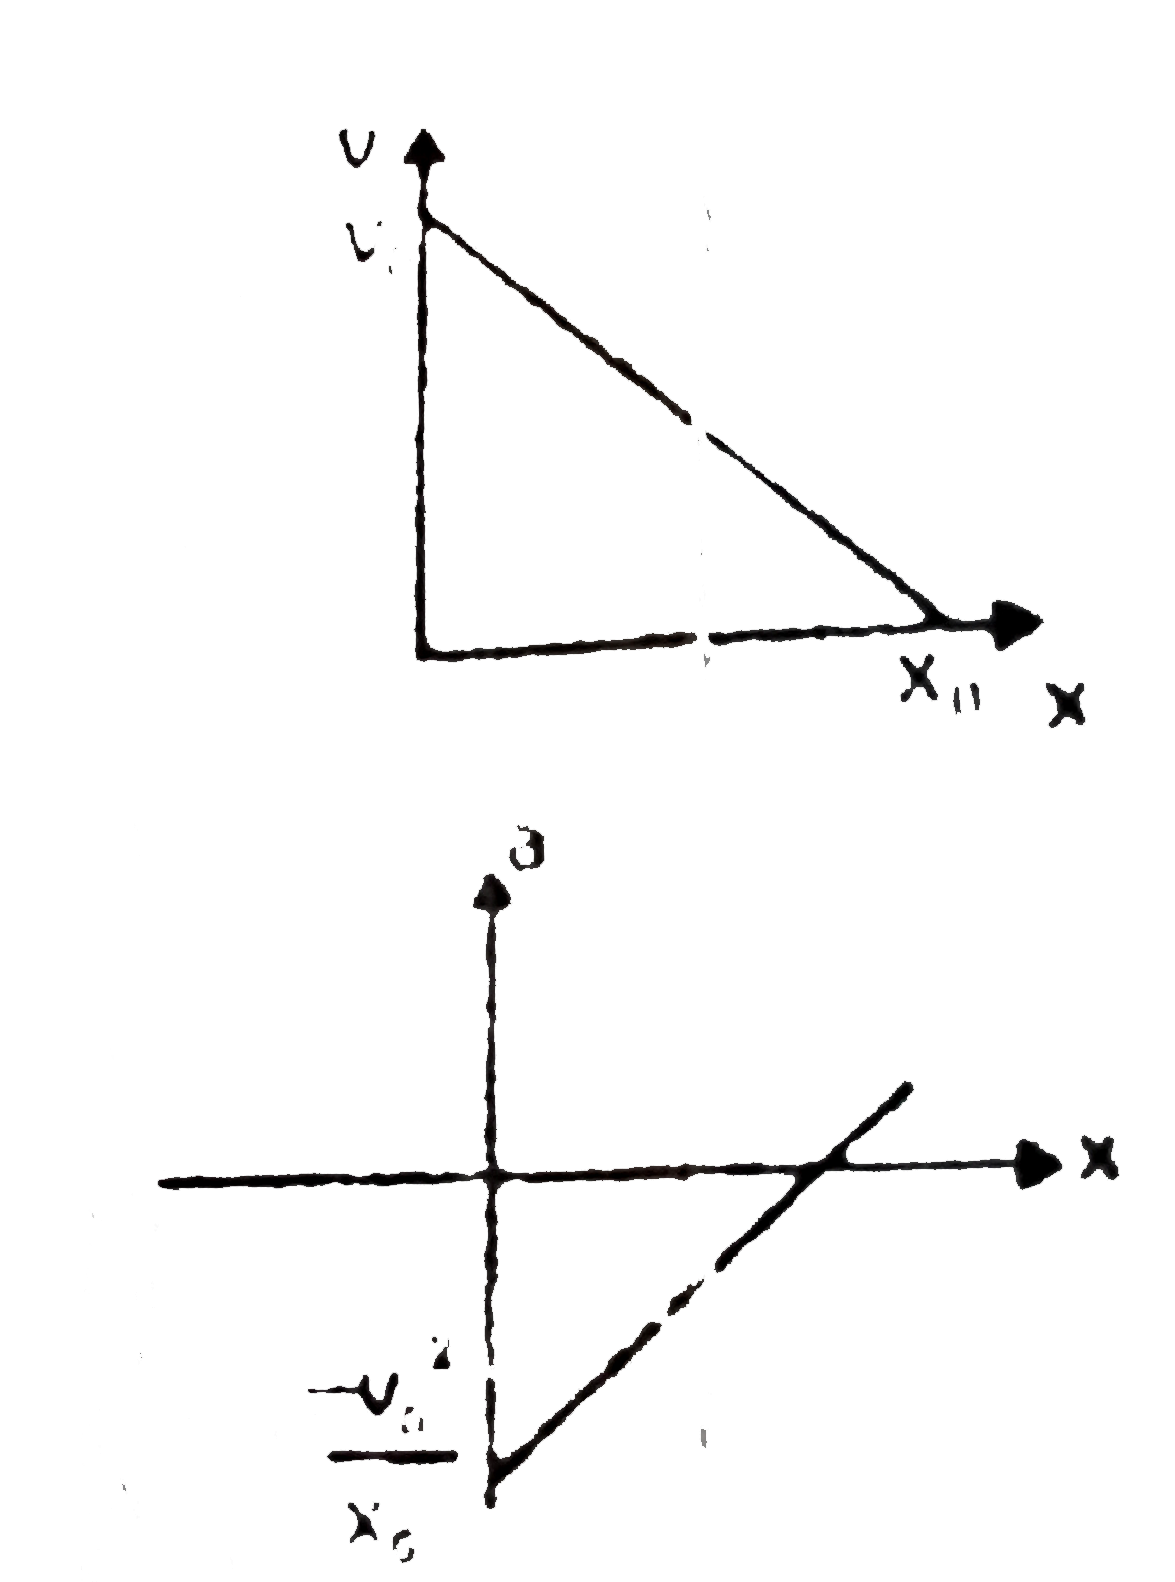
- The given graph shows the variation of velocity with displacement. Whi...
Text Solution
|