


Similar Questions
Explore conceptually related problems
Recommended Questions
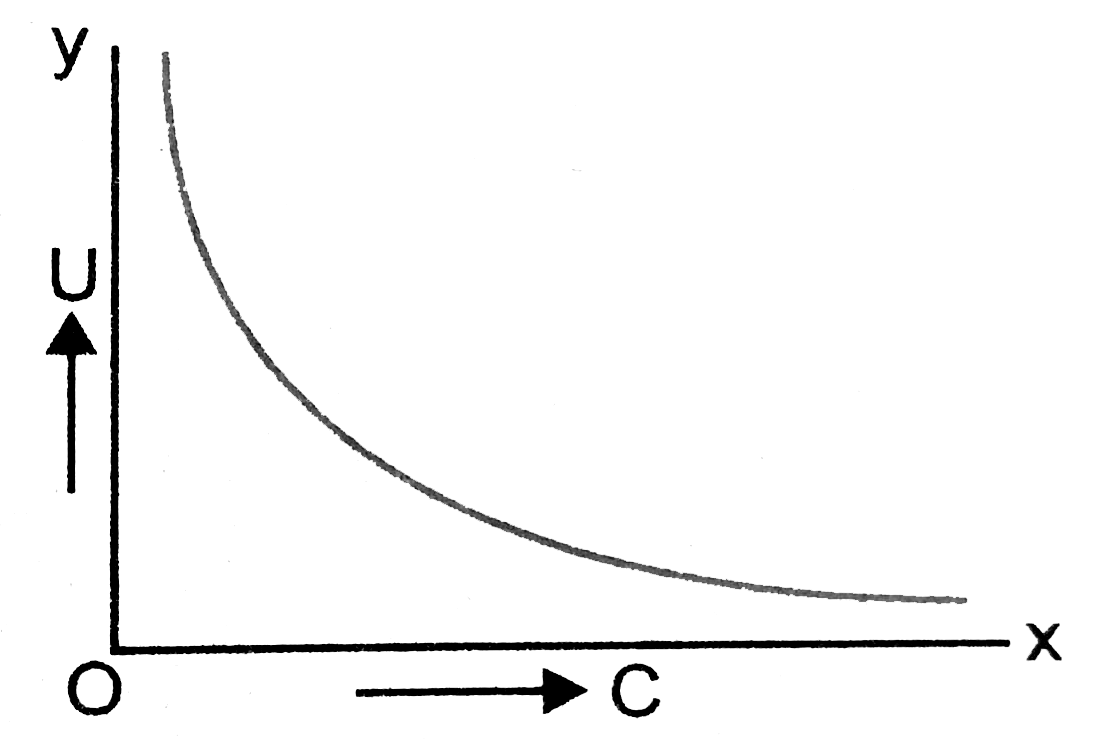
- The graph in Fig, shows variation of total energy U stored in the cap...
Text Solution
|
- A capacitor of capacitor of capacitance 2.0muF is charge to a potenti...
Text Solution
|
- The graph in Fig, shows variation of total energy U stored in the capa...
Text Solution
|
- दिये गये ग्राफ में एक संधारित्र की कुल संचित ऊर्जा (U ) तथा धारिता का ...
Text Solution
|
- संधारित्र की धारिता की परिभाष दीजिये। सिद्ध कीजिए कि आवेशित संधारित्र ...
Text Solution
|
- The graph shown here, shows the variation of the total energy ( E) sto...
Text Solution
|
- एक संधारित्र की धारिता 25muF है। इसे विभव 250 वोल्ट तक आवेशित किया जात...
Text Solution
|
- The capacitance of a charged capacitor is C and the energy stored in i...
Text Solution
|
- In an experiment with a capacitor, the charge which was stored is meas...
Text Solution
|