A

B

C

D

Text Solution
Verified by Experts
The correct Answer is:


Topper's Solved these Questions
Similar Questions
Explore conceptually related problems
IBPS & SBI PREVIOUS YEAR PAPER-DATA INTERPRETATION AND CASELETS-QUESTIONS
- What is the percentage of qualified aspirants with respect to appeared...
Text Solution
|
- What is the ratio between number of candidates qualified from States B...
Text Solution
|
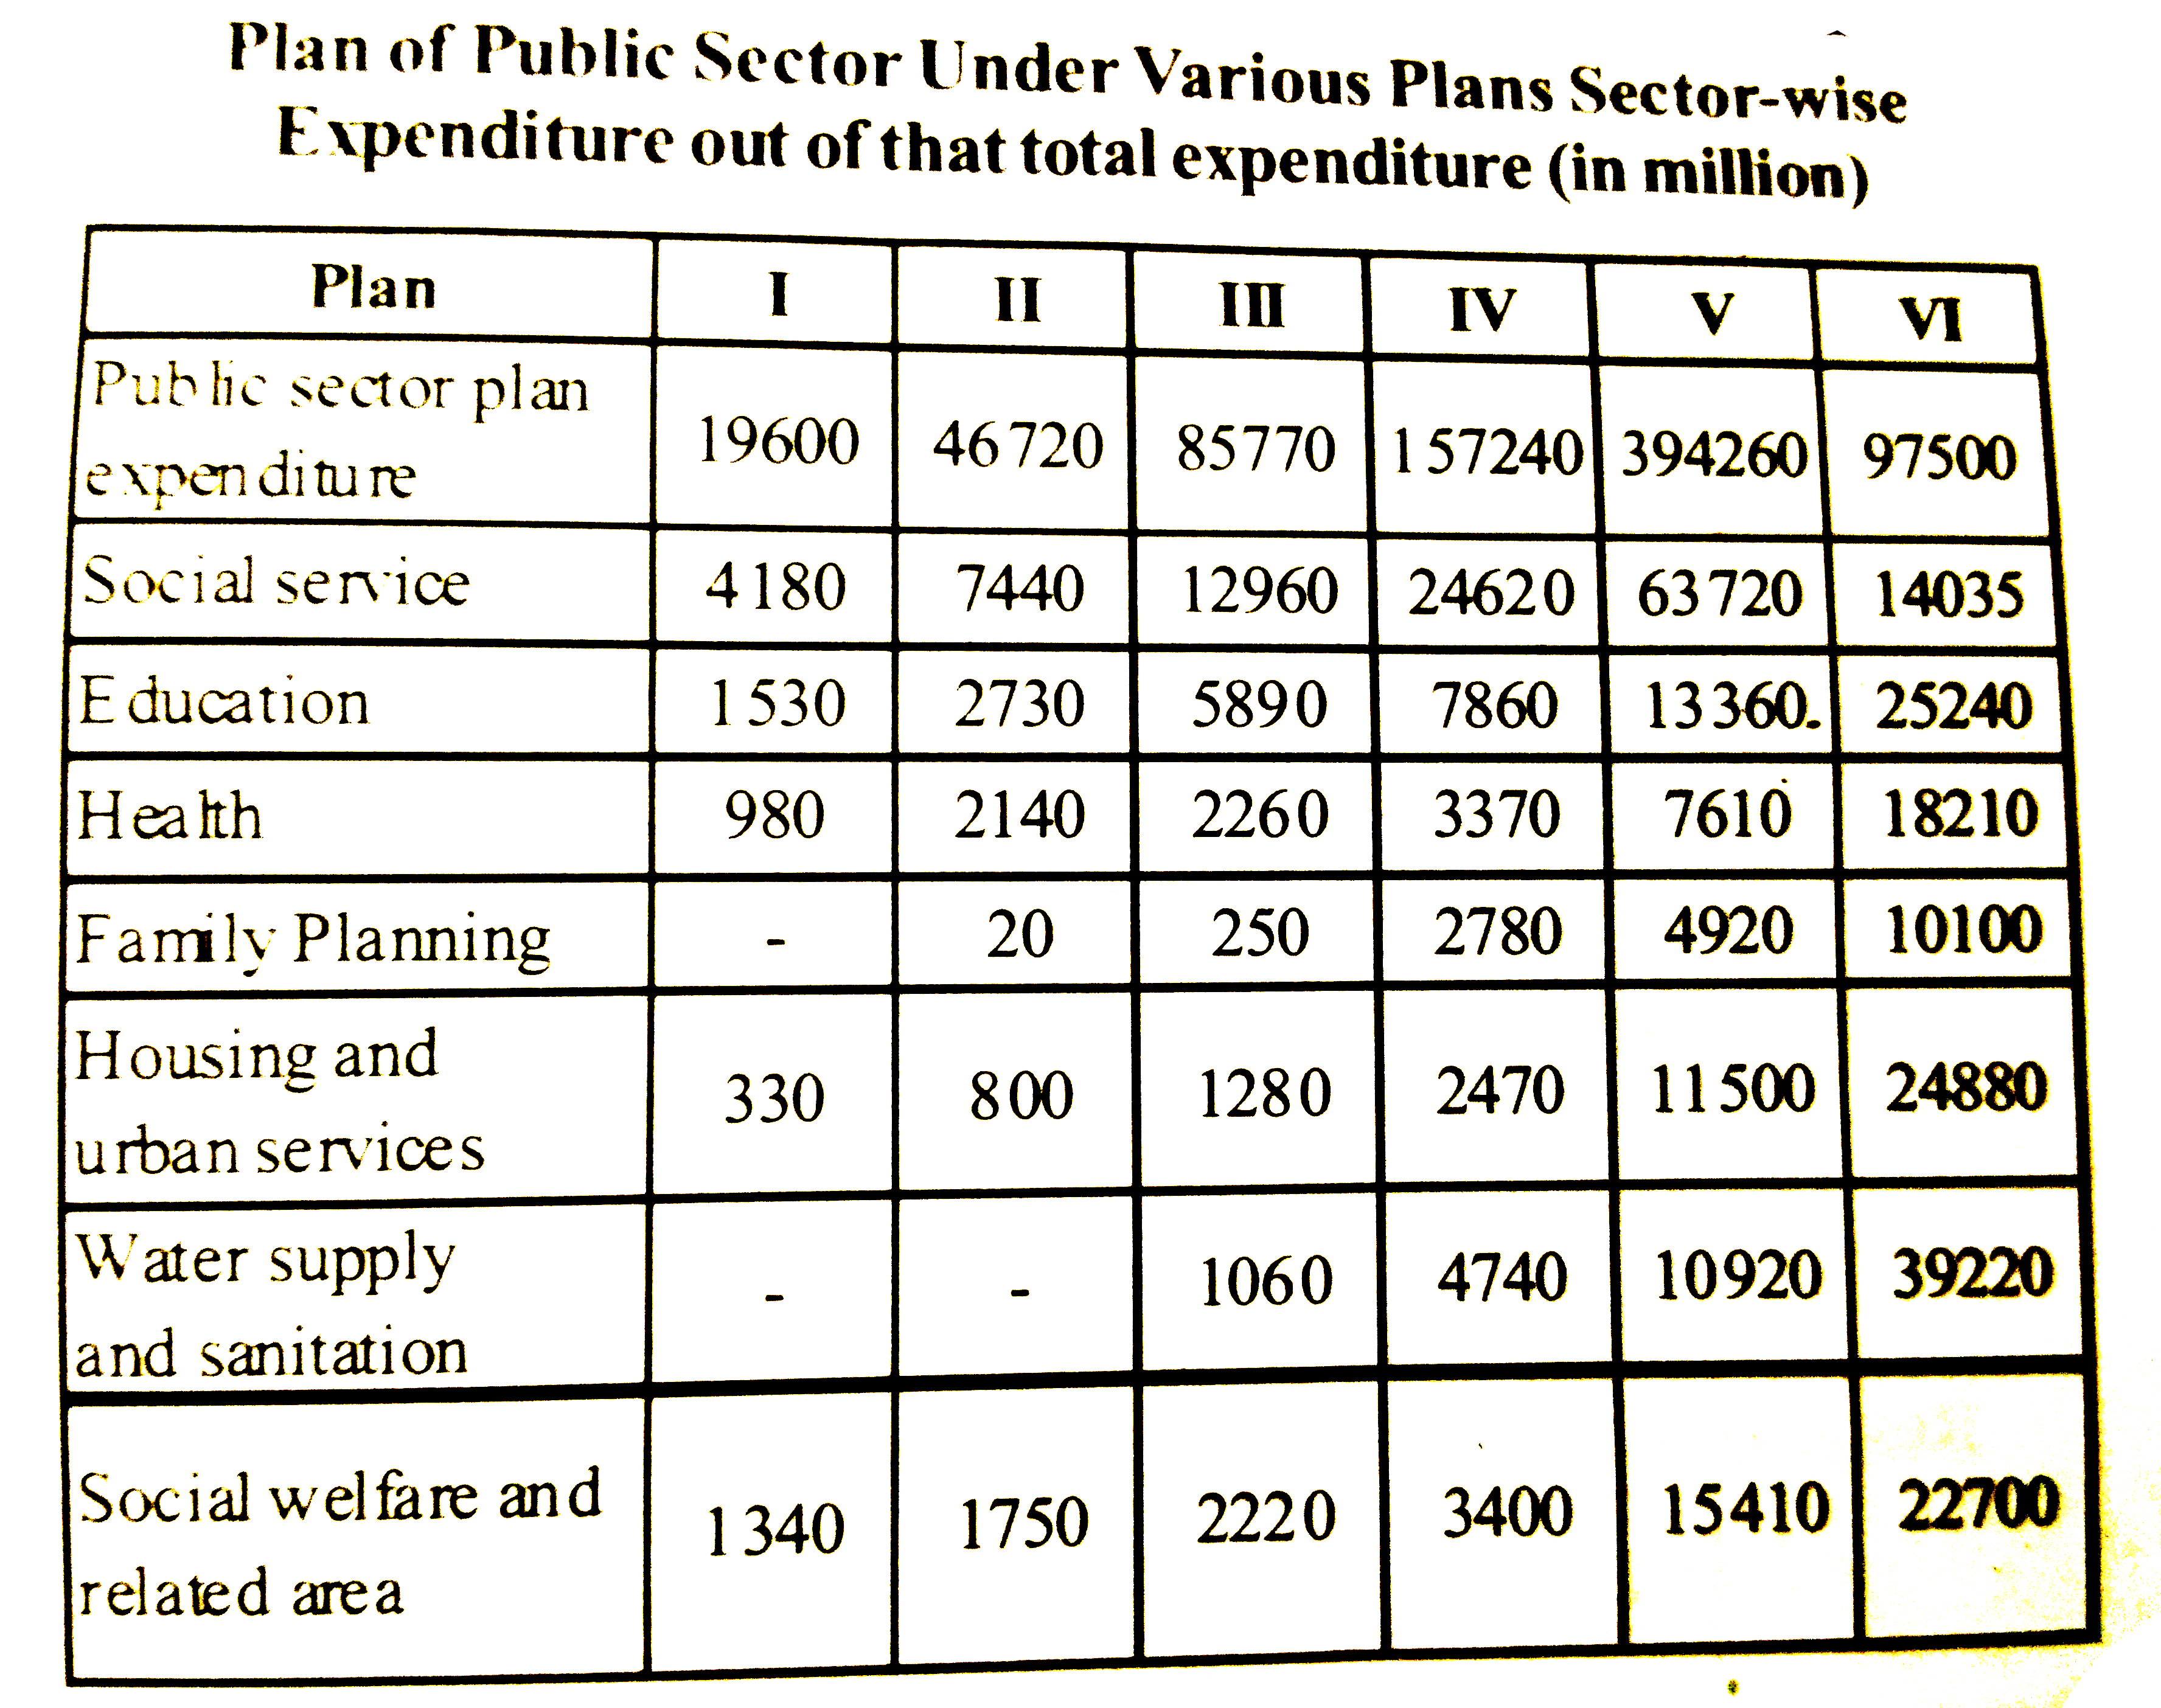
- In various plans in the ratio of expenditure on public sector, which o...
Text Solution
|
- The ratio of public sector expenditure of the expenditure on social se...
Text Solution
|
- In the sucessive plans in the ratio of public sector expenditure ther...
Text Solution
|
- For plan VI out of public sector expenditure, what per cent of expedit...
Text Solution
|
- For all the given plans, what was the difference in expenditure on edu...
Text Solution
|
- What is the number of men working in the Marketing department ?
Text Solution
|
- What is the respective ratio of the number of women working in the HR ...
Text Solution
|
- The number of men working in the production department of the organis...
Text Solution
|
- The number of women working in the IT department of the organization f...
Text Solution
|
- What is the total number of men working in the organization
Text Solution
|
- In the case of which mill is the processing of wool in March the highe...
Text Solution
|
- The wool-processing by Warmwear in April is what percent of its wool-p...
Text Solution
|
- Which of the five mills has the highest ratio of wool processing done...
Text Solution
|
- In the case of which mill is the wool-processing in Febuary and Marh t...
Text Solution
|
- The total of wool-processing done by Kiwi during the given period is a...
Text Solution
|
- If the following pie-chart shows the preference of musical instruments...
Text Solution
|
- If the following pie-chart shows the preference of musical instruments...
Text Solution
|
- If the following pie-chart shows the preference of musical instruments...
Text Solution
|