Home
Class 14
MATHS
By what per ent is the total production ...


By what per ent is the total production of wheay by three states in the year 2002,2003,2004 more or less than that in the year 2005,2006 and 2007 ?

A

`2.5%`

B

`2.6%`

C

`1.9%`

D

`1.09%`

Text Solution

Verified by Experts

The correct Answer is:
D

What production by three stats :
Year `2002rArr 3300+2900+2700=8900` quintals
Year `2003rArr 2800+2700+3700=9200` quintals
Year `200 rArr 2900+3100+3800=9800` quintals
Total production in theses years
`=8900+9200+9800=27900` quintals
Year `2005 rArr 2100+3000+3500=86` quintals
Year `2006 rArr 2400+2900+3800=9100` quintals
Year `2007 rArr 2900+3400+3600=9900` quintals
Total production `=8600+9100+9900=27600` quintals
Required percentage `=(27900-27600)/(27600xx10=1.09%`
Promotional Banner

Topper's Solved these Questions

  • AREA AND PERIMETER

    IBPS & SBI PREVIOUS YEAR PAPER|Exercise MCQ|75 Videos
  • DATA SUFFICIENCY AND DATA ANALYSIS

    IBPS & SBI PREVIOUS YEAR PAPER|Exercise Multiple choice question|126 Videos

Similar Questions

Explore conceptually related problems

What was the total production of wheat by these three states in the year 2007 ? ( in quintals)

What was the averae production of whart by all three states in the year 2005? (in quintals)

Study the bar graph and answer the question that follows. The ratio of the total production of organic fertilizers by the company in the years 2005. 2006 and 2008 to the total production in the years 2001, 2002, 2003 and 2004. is:

By what per cent is the amount received fromt eh sales in the year 2005 of the company more than the expenditure on production in the year 2008?

Study the following graph and answer the following questions :- Following graph shows the actual & target productin of a companry over the period (in thousand tonnes) the target production in the year 2001, 2003 and 2005 together is what percent of acutal production of 2002, 2004 and 2006 together ?

Production of three different flavours soft drinks X, Y and Z over a period of six years has been expressed in the following graph. Study the graph and answer the questions What percent of the total production of flavour X in 2005 and 2006 combined is the total production of flavour Z in 2007 and 2008 combined ?

Three essential commoditites, the quantities of their consumption and their prices in the years 2006 and 2007 are listed below. The cost of living index for the years 2006 and 2007 is calculated on the prices of these three commodities only. ltimg src="https://d10lpgp6xz60nq.cloudfront.net/physics_images/PS_MATH_IX_C18_E06_002_Q01.png" width="80%"gt Find the cost of living index of the year 2007, taking 2006 as the bae year.

Study the following graph carefully to answer the questions given below. Expenditure in lakhs) of three different Companies in Five Different Years What was the difference between the total expenditure of Company B in the year 2006 and 2008 together and the total expenditure of Company C in the year 2007 and 2009 together?

What is the sum of students passed from university B in the years 2003, 2005 and 2006 together?

Population of state E in 2007 is what per cent of the total population of all the states together in that year?

IBPS & SBI PREVIOUS YEAR PAPER-DATA INTERPRETATION AND CASELETS-QUESTIONS
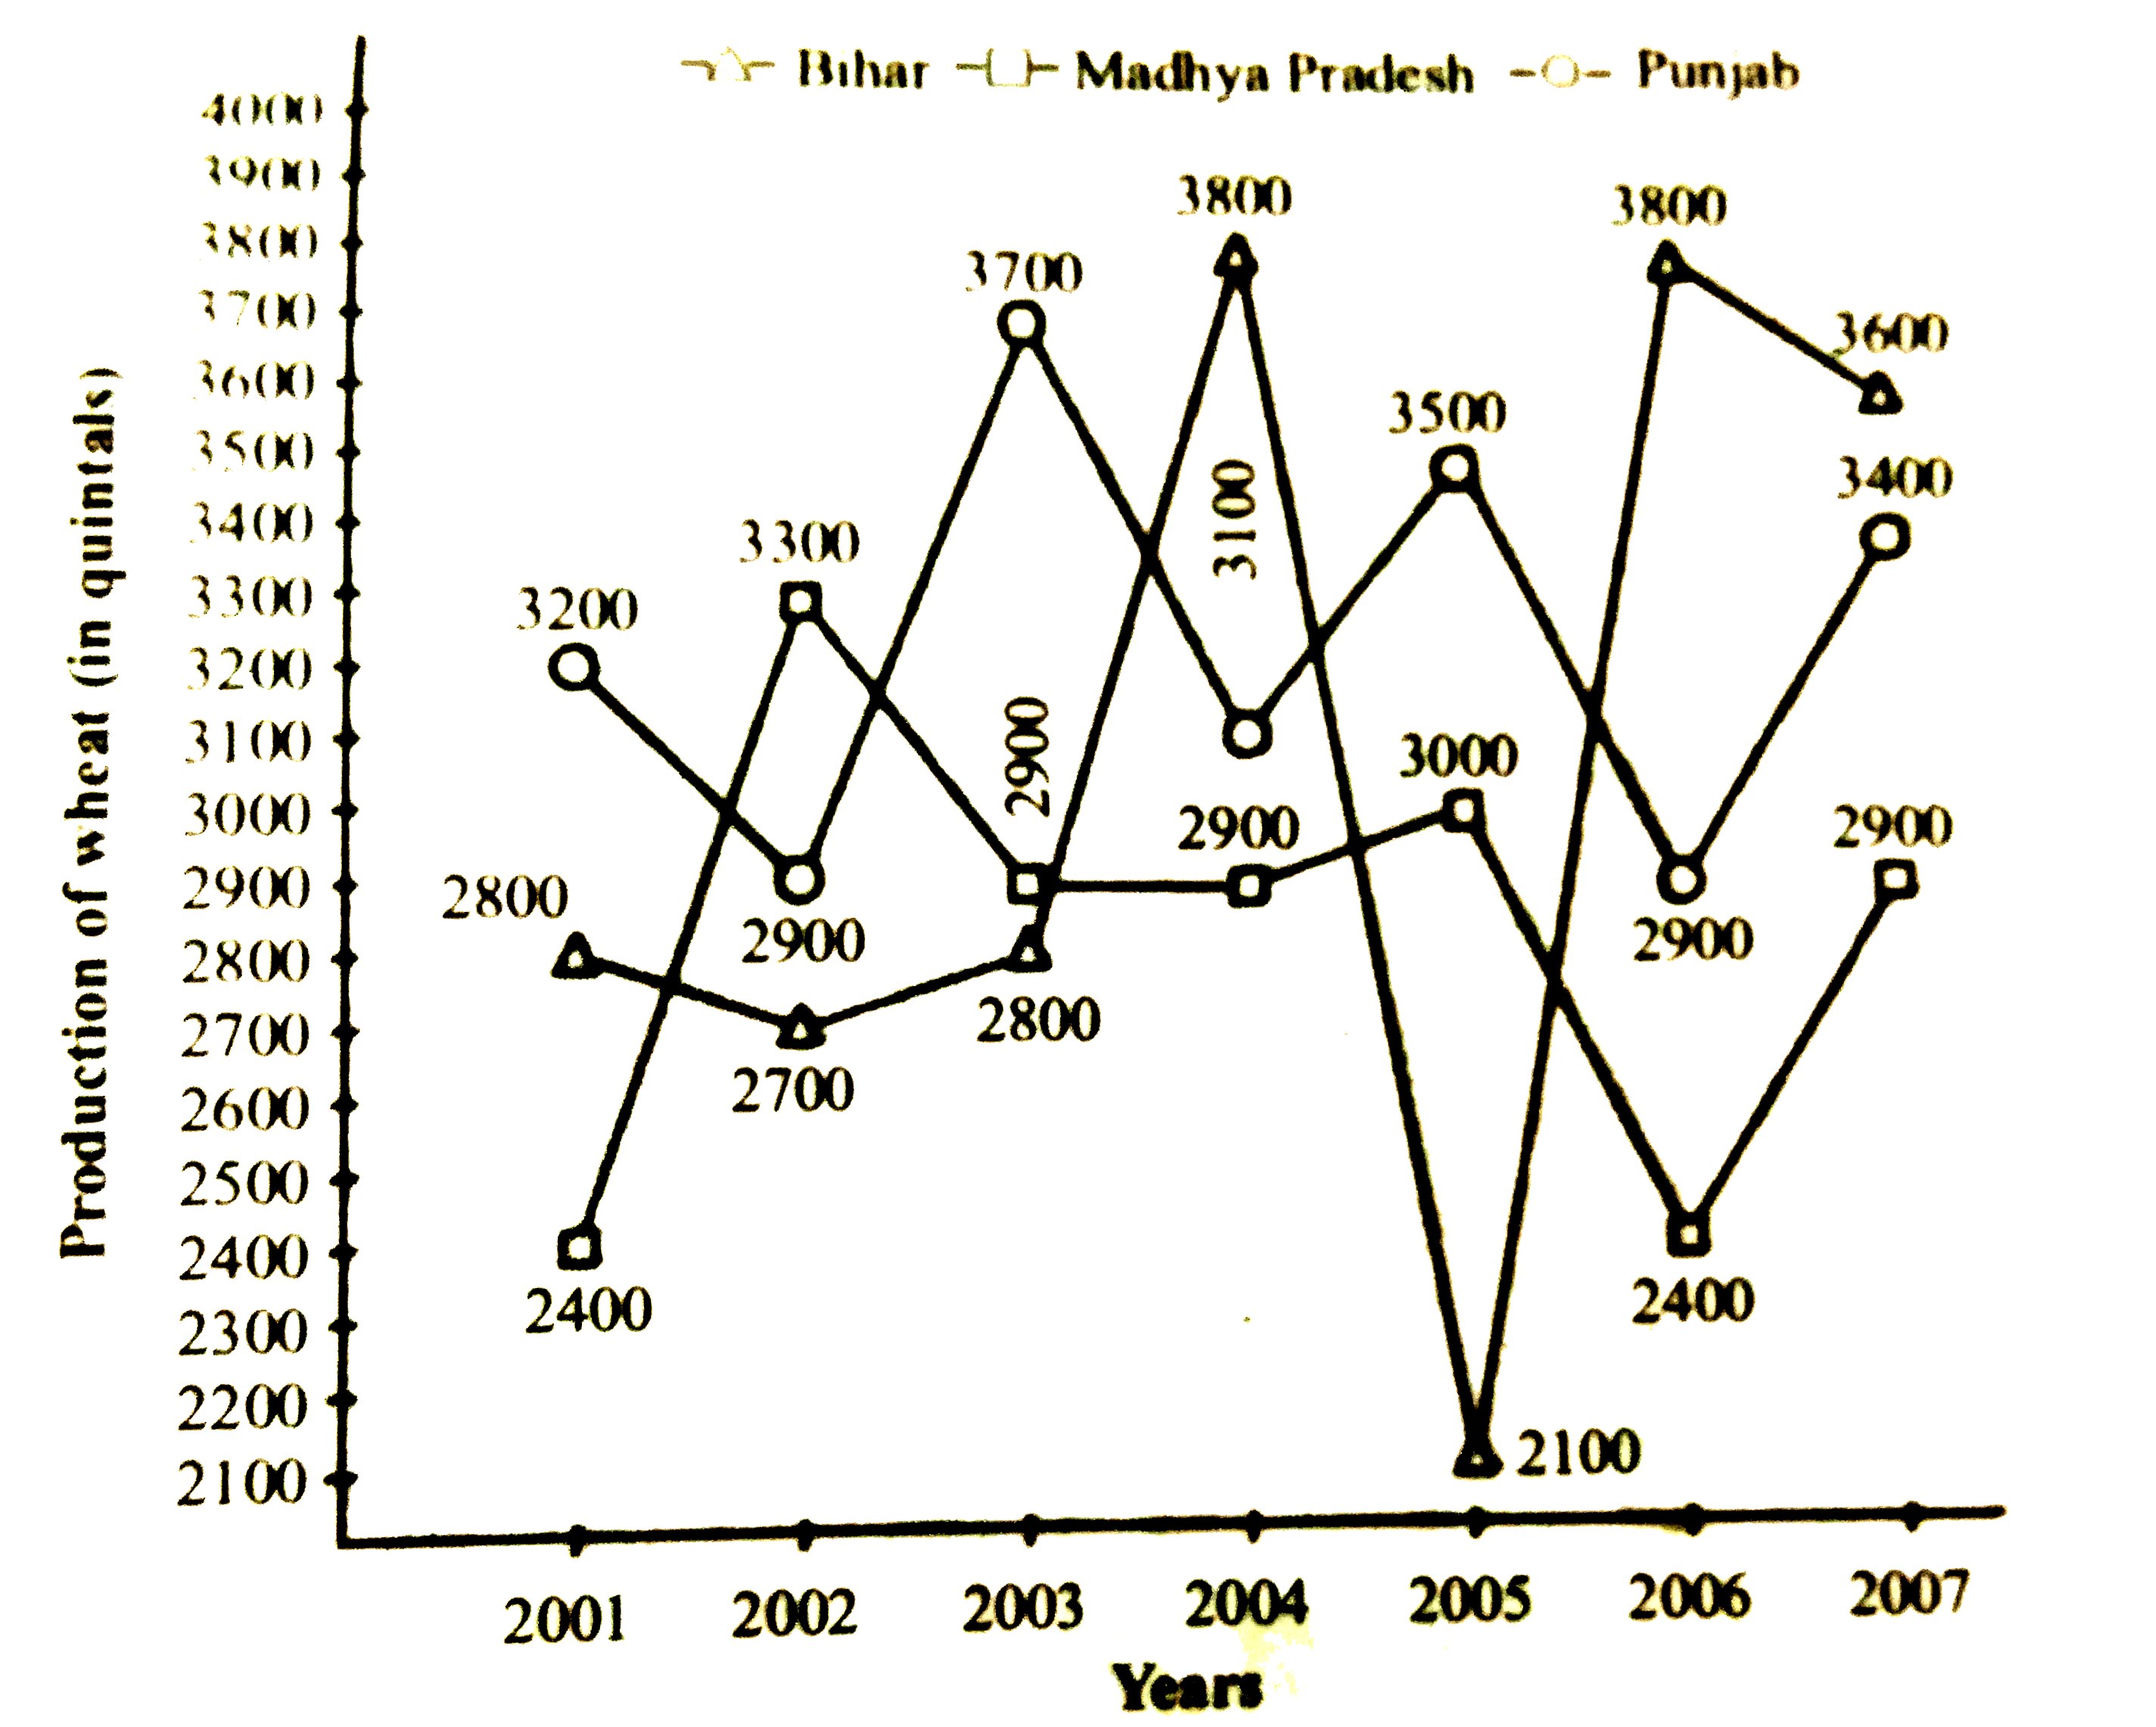
  1. In the given years, what is the average production of wheat in Bihar? ...

    Text Solution

    |

  2. If the productions of wheat in Bihar in the years 2001,2002, 2003 and ...

    Text Solution

    |

  3. By what per ent is the total production of wheay by three states in th...

    Text Solution

    |

  4. What was the total production of wheat by these three states in the ye...

    Text Solution

    |

  5. The number of post graduate engineers employed in the company W is wha...

    Text Solution

    |

  6. What is the averae number of junior engineers employed in all the comp...

    Text Solution

    |

  7. What is the difference between the average number of junior engineers ...

    Text Solution

    |

  8. If the number of assistant engineers employeed in all the companies be...

    Text Solution

    |

  9. If the numbers of all the engineers in the company V, company X and co...

    Text Solution

    |

  10. What is the ratio between the number of assistant engineers employed i...

    Text Solution

    |

  11. What is the ratio of between male employees working in the country I a...

    Text Solution

    |

  12. What is the ratio between the number of male employess and female empl...

    Text Solution

    |

  13. What is the approximate average number of male employees in countries,...

    Text Solution

    |

  14. What is the average of female employees in the countries IV and VII ?

    Text Solution

    |

  15. In an increases of 40% is made in the average number of female employe...

    Text Solution

    |

  16. By what per cent is the total number of employees in countries V, VI a...

    Text Solution

    |

  17. What is the difference between the number of academic books published ...

    Text Solution

    |

  18. How many books were given to each distributor by publisher Q if each p...

    Text Solution

    |

  19. What is the averge number of non-academic books published by publisher...

    Text Solution

    |

  20. At a certain rate of interest the compound interest of 3 years and sim...

    Text Solution

    |