Home
Class 14
MATHS
What was the ratio of the expenditure of...


What was the ratio of the expenditure of company 'A' to that of company 'C' ?

A

`6:1`

B

`24:5`

C

`25:4`

D

Cannot be determined

Text Solution

Verified by Experts

The correct Answer is:
C

Ratio of income (A's C''s) `=18:3=6:1`
`:.` Ratio of their exp. `(6x(100)/(20))/(x xx(100)/(125))=25:4`
Promotional Banner

Topper's Solved these Questions

  • AREA AND PERIMETER

    IBPS & SBI PREVIOUS YEAR PAPER|Exercise MCQ|75 Videos
  • DATA SUFFICIENCY AND DATA ANALYSIS

    IBPS & SBI PREVIOUS YEAR PAPER|Exercise Multiple choice question|126 Videos

Similar Questions

Explore conceptually related problems

The following line graph gives the percent profit earned by two companies X and Y during the period Percentage profit earned by two companies X and Y =("Income-Expenditure")/("Expenditure")xx100 If the incomes of two companies were equal in 2008, then what was the ratio of expenditure of company X to that of company Y in 2008?

Study the following graph carefully to answer the questions given below. Expenditure in lakhs) of three different Companies in Five Different Years What was the ratio of the expenditure of Company A in the year 2009 to the expenditure of Company B in the year 2005?

Study the following graph carefully to answer the question that follow In the year 2014 the income of both the companies A and B was the same what was the respective ratio of expenditure of company A to the expenditure of company B in that year?

Per cent Profit = ("Income-Expenditure")/("Expenditure")xx100 If in the year 2008, the income of both the companies A and B was the same, what was the respective ratio of expenditure of company A to te expenditure of comapny B in that year ?

If in the given financial year income of company 'D' was Rs. 535 cr, what was the approximate expenditure of company 'B' in that year ?

Study the following graph carefully and answer the given questions :- The following graph shows the % profit of two companies over the years :- If income of company A in the year 2006 and 2009 are same then what is the respective ratio of expenditure of company A in both the same years ?

Study the following graph carefully and answer the given questions :- The following graph shows the % profit of two companies over the years :- In which of the following years the ratio of expenditure to income was the least for company B?

The given Bar Graph presents the Revenue and Expenditure (in crores of Rupees ) of a company during the five year period, 2014-2018. What is the ratio of the total revenue of the company in 2015 and 2018 to that of its expenditure in 2014 and 2018 ?

IBPS & SBI PREVIOUS YEAR PAPER-DATA INTERPRETATION AND CASELETS-QUESTIONS
  1. If all the others of Lok Sabha join the party B then what will be the ...

    Text Solution

    |

  2. Out of the total members of pary B inparliament, what percentage of th...

    Text Solution

    |

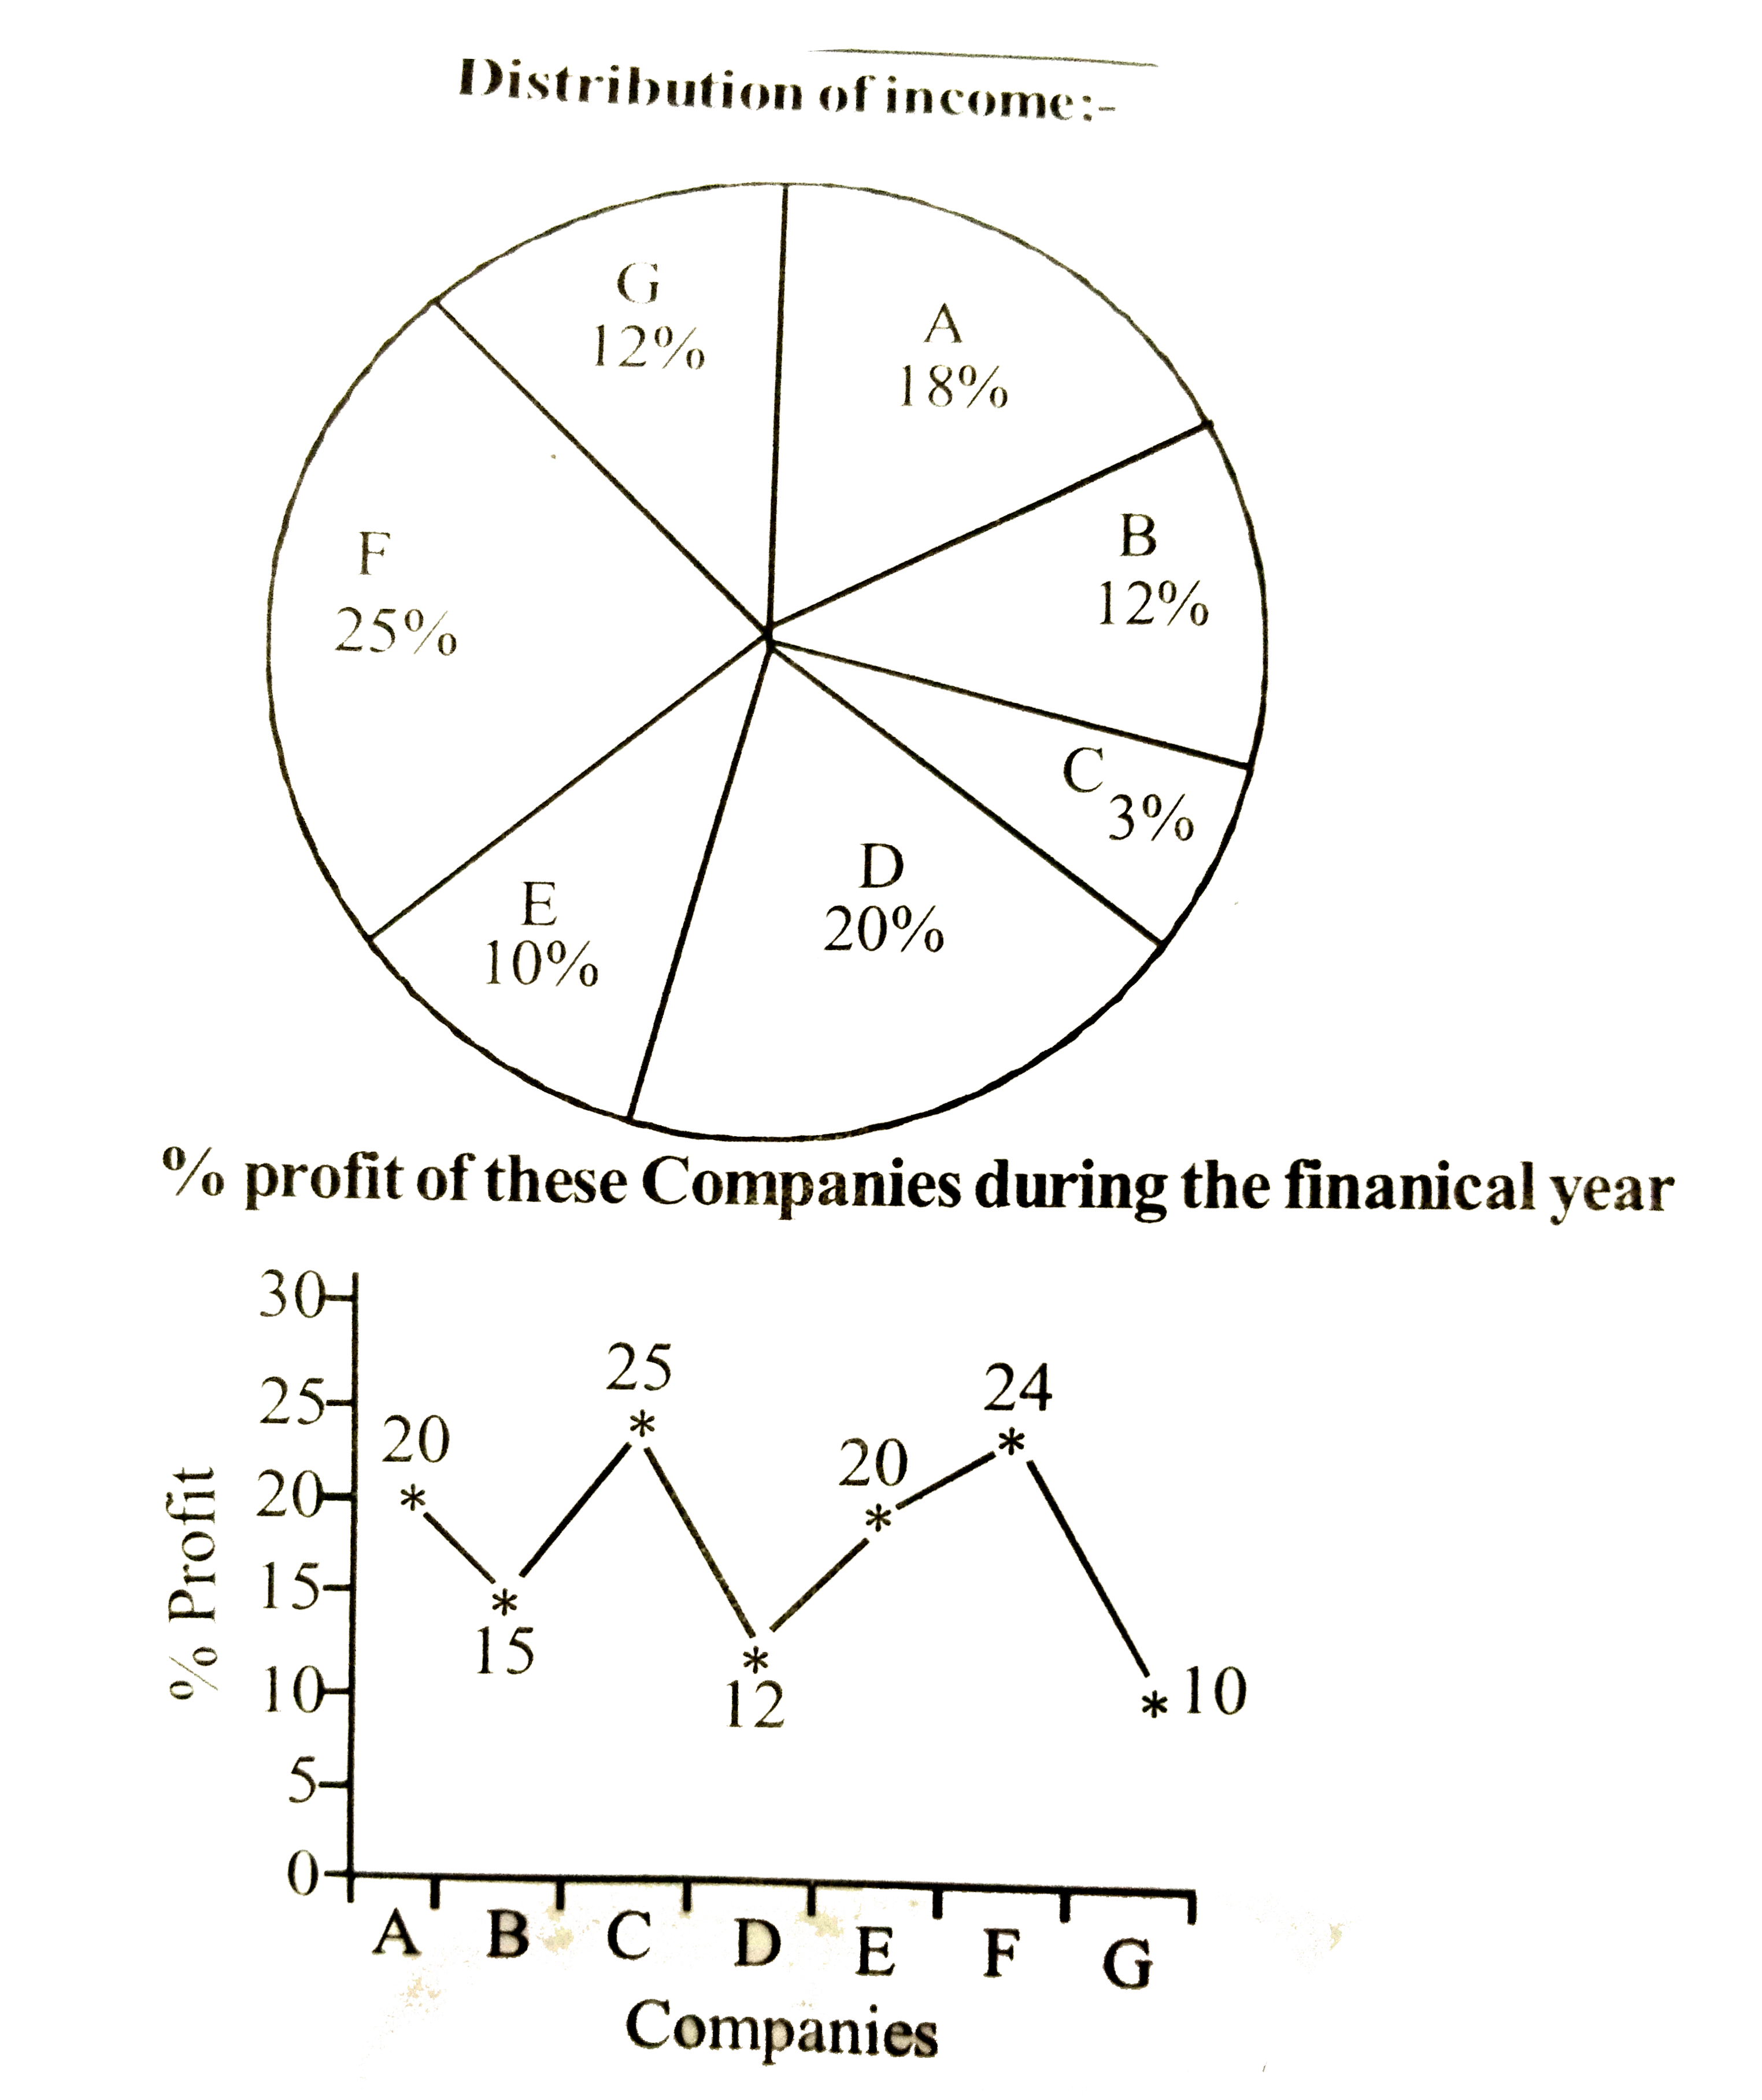
  3. What was the ratio of the expenditure of company 'A' to that of compan...

    Text Solution

    |

  4. A and B are:-

    Text Solution

    |

  5. Which of the following compaanies has recorded maximum profit (in term...

    Text Solution

    |

  6. If in the given financial year income of company 'D' was Rs. 535 cr, w...

    Text Solution

    |

  7. The expenditure of Company F was Rs. 750 cr. What was the total inome ...

    Text Solution

    |

  8. In 2012, what was the ratio of profit of the compaby P to the profit o...

    Text Solution

    |

  9. In which of the given years was the total profit of both the companies...

    Text Solution

    |

  10. In how many given years was the profit of the company P{ more than the...

    Text Solution

    |

  11. Number of units of three different products P(1),P(2) and P(3) produce...

    Text Solution

    |

  12. Number of units of three different products P(1),P(2) and P(3) produce...

    Text Solution

    |

  13. Number of units of three different products P(1),P(2) and P(3) produce...

    Text Solution

    |

  14. Number of units of three different products P(1),P(2) and P(3) produce...

    Text Solution

    |

  15. If the production cost of each of product P(2) is Rs. 430 , then wha i...

    Text Solution

    |

  16. HBO and star plus have viewers

    Text Solution

    |

  17. Which of the following represents the ratio of the number of viewers o...

    Text Solution

    |

  18. The number of viewers of star plus forms what percentage of number of ...

    Text Solution

    |

  19. Total number of vierwers HBO and Neo sports have ?

    Text Solution

    |

  20. The total of viewers NDTV and BBC forms what % of total number of view...

    Text Solution

    |