A
B
C
D
Text Solution
Verified by Experts
The correct Answer is:


IBPS & SBI PREVIOUS YEAR PAPER-DATA INTERPRETATION AND CASELETS-QUESTIONS
- What is the ratio of total books sold by store P and R together to th...
Text Solution
|
- What is the difference between average of book sold by store P and T t...
Text Solution
|
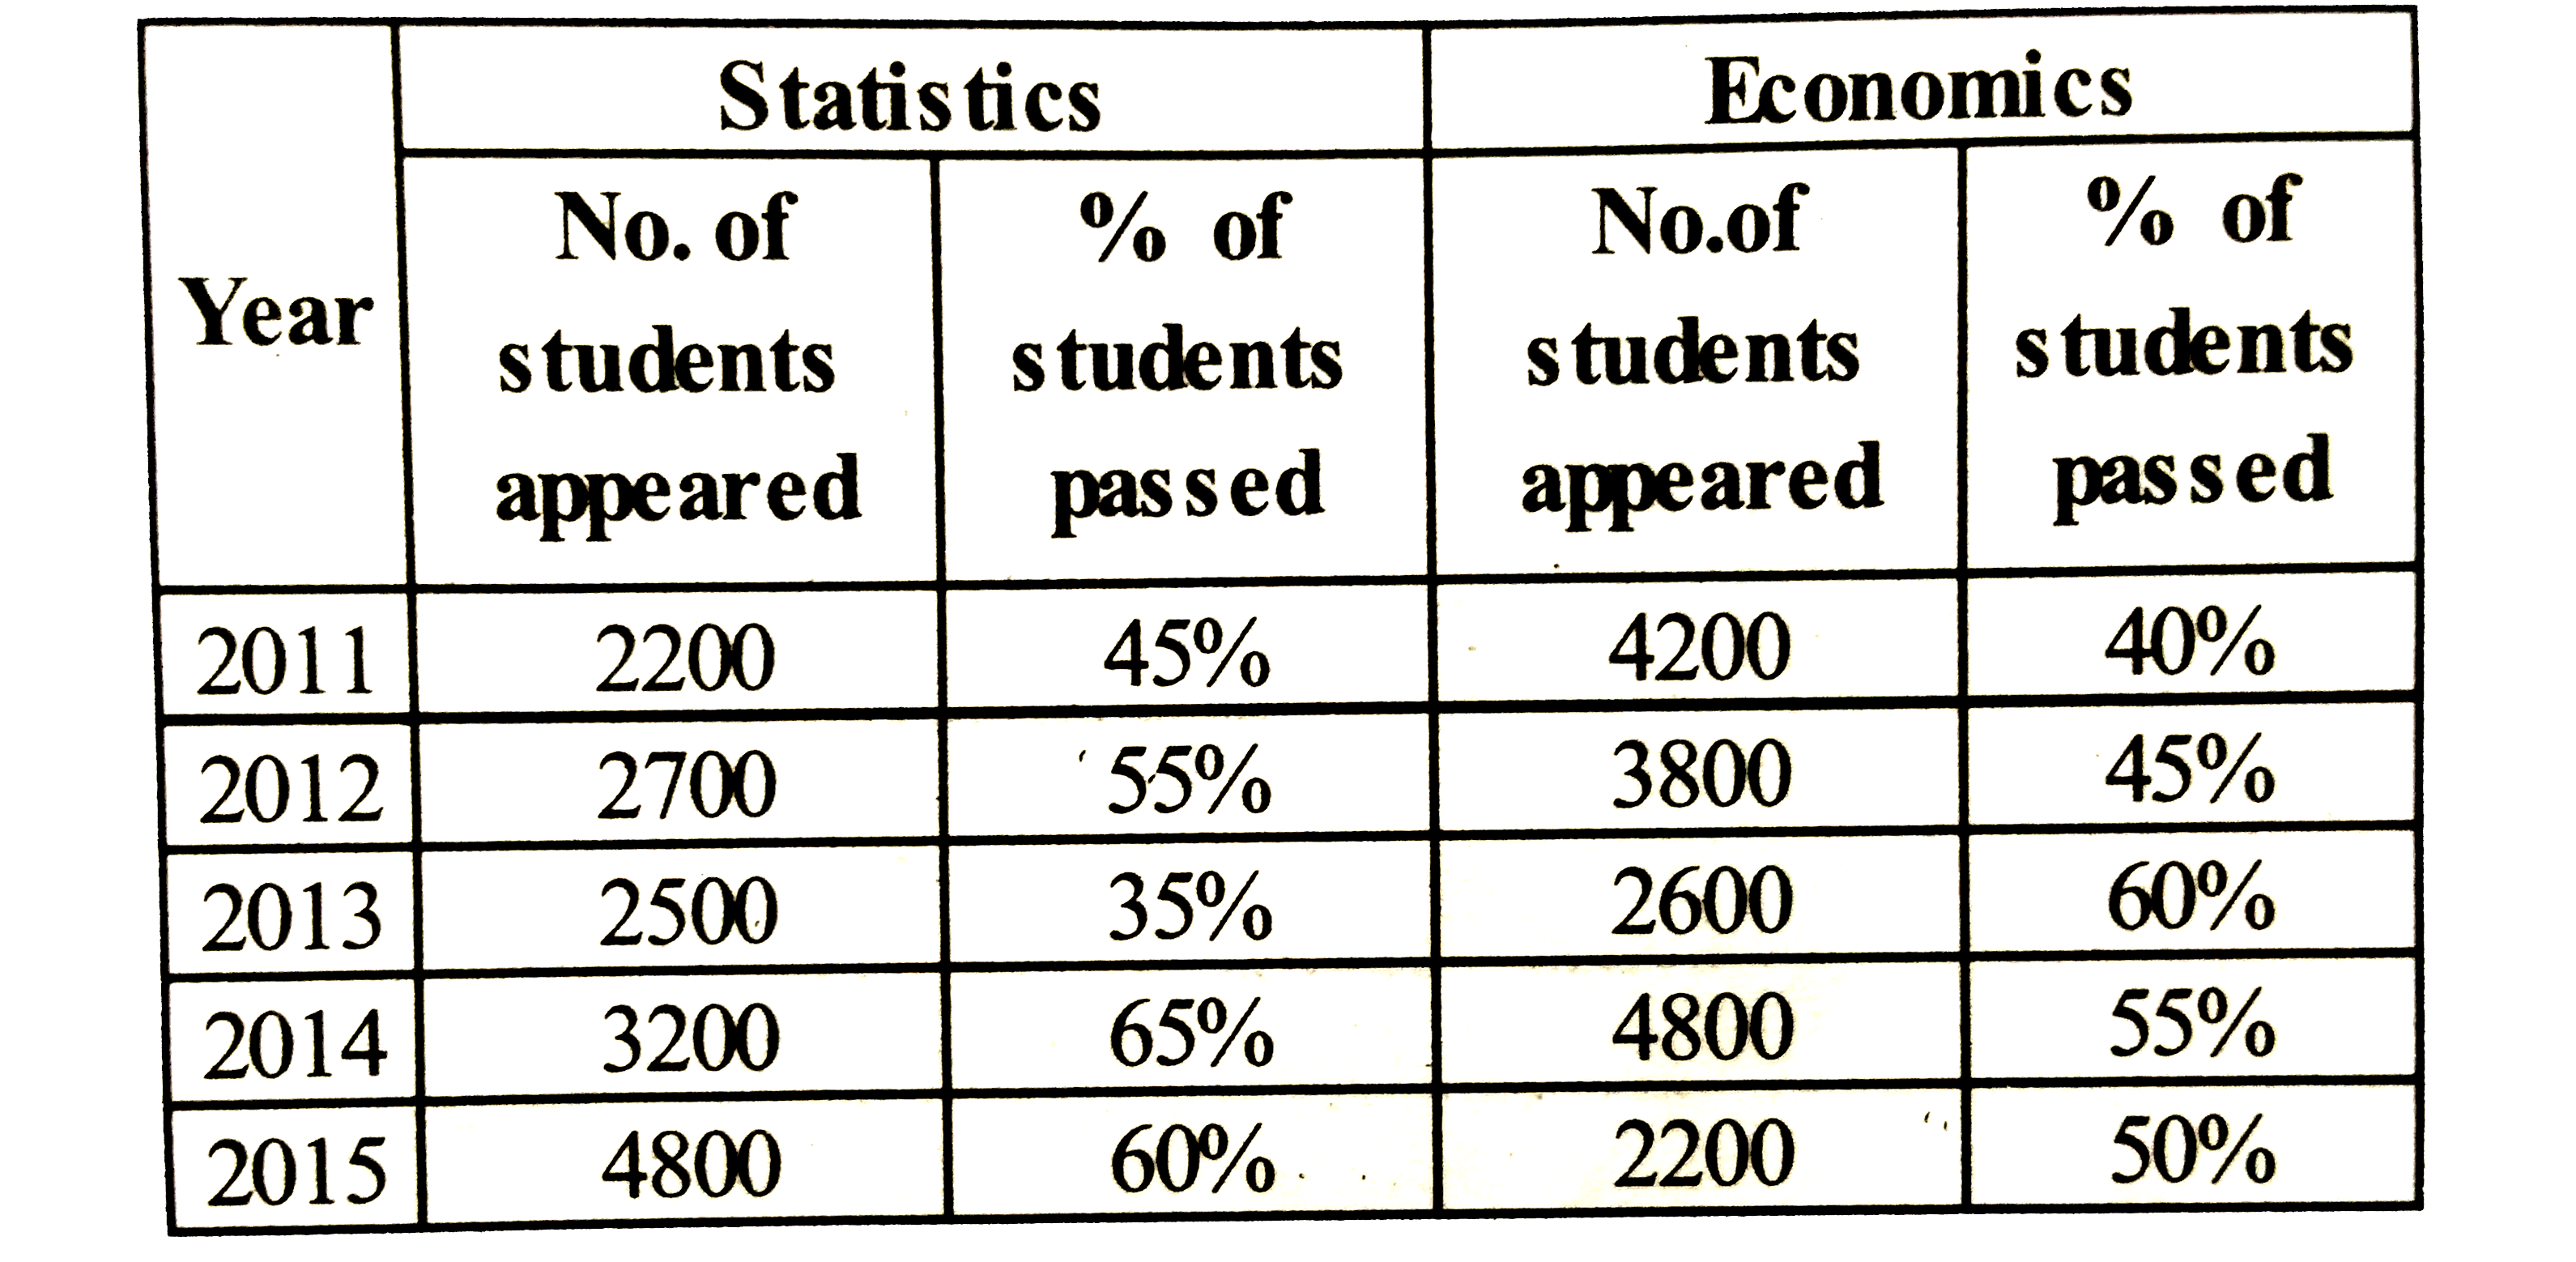
- No. of students and % of students passed out of those who appeared are...
Text Solution
|
- No. of students and % of students passed out of those who appeared are...
Text Solution
|
- No. of students and % of students passed out of those who appeared are...
Text Solution
|
- No. of students and % of students passed out of those who appeared are...
Text Solution
|
- No. of students and % of students passed out of those who appeared are...
Text Solution
|
- Find the ratio of the total number of boys visited the place on Tuseds...
Text Solution
|
- Total number of boys and girls together visited the place on Tuesday a...
Text Solution
|
- Find the difference between the total number of girls visited the plac...
Text Solution
|
- If on Saturday the number of boys and number of girls increased by 25%...
Text Solution
|
- Total number of boys and girsl visited the place on Monday and Tuesday...
Text Solution
|
- The table shows the online and offline contestants takin part in a sur...
Text Solution
|
- The table shows the online and offline contestants takin part in a sur...
Text Solution
|
- The table shows the online and offline contestants takin part in a sur...
Text Solution
|
- The table shows the online and offline contestants takin part in a sur...
Text Solution
|
- The table shows the online and offline contestants takin part in a sur...
Text Solution
|
- The table shows the online and offline contestants takin part in a sur...
Text Solution
|
- Given below are two pie charts which show the percentage distribution ...
Text Solution
|
- iven below are two pie charts which show the percentage distribution o...
Text Solution
|