A
B
C
D
Text Solution
Verified by Experts
The correct Answer is:


Topper's Solved these Questions
Similar Questions
Explore conceptually related problems
IBPS & SBI PREVIOUS YEAR PAPER-DATA INTERPRETATION AND CASELETS-QUESTIONS
- he table shows the number of the ticket of 5 movies sold in 6 differen...
Text Solution
|
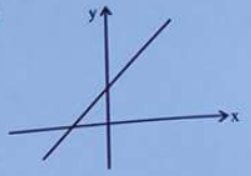
- Which of the following equation is best representation of given grap...
Text Solution
|
- Which of the following equation is best representation of given grap...
Text Solution
|
- he table shows the number of the ticket of 5 movies sold in 6 differen...
Text Solution
|
- What is the approximate percentage of boys in the school ?
Text Solution
|
- How many boys are anrolled in Singing and Craft together ?
Text Solution
|
- What is the total number of girls enrolled in Swimming and Drawing tog...
Text Solution
|
- Number of girls enrolled in Dancing is what per cent of total number ...
Text Solution
|
- What is the respective ratio of number of girls enrolled in Swimming t...
Text Solution
|
- The following bar graph shows the total number of students (Boys+Girls...
Text Solution
|
- The following bar graph shows the total number of students (Boys+Girls...
Text Solution
|
- The following bar graph shows the total number of students (Boys+Girls...
Text Solution
|
- The following bar graph shows the total number of students (Boys+Girls...
Text Solution
|
- The following bar graph shows the total number of students (Boys+Girls...
Text Solution
|
- The following pie chart 1 shows the percentage distribution of total n...
Text Solution
|
- The following pie chart 1 shows the percentage distribution of total n...
Text Solution
|
- The following pie chart 1 shows the percentage distribution of total n...
Text Solution
|
- The following pie chart 1 shows the percentage distribution of total n...
Text Solution
|
- The following pie chart 1 shows the percentage distribution of total n...
Text Solution
|
- The following table shows the number of classes taken by each Teacher ...
Text Solution
|