A
B
C
D
Text Solution
Verified by Experts
The correct Answer is:


IBPS & SBI PREVIOUS YEAR PAPER-DATA INTERPRETATION AND CASELETS-QUESTIONS
- What is the respective ratio of number of girls enrolled in Swimming t...
Text Solution
|
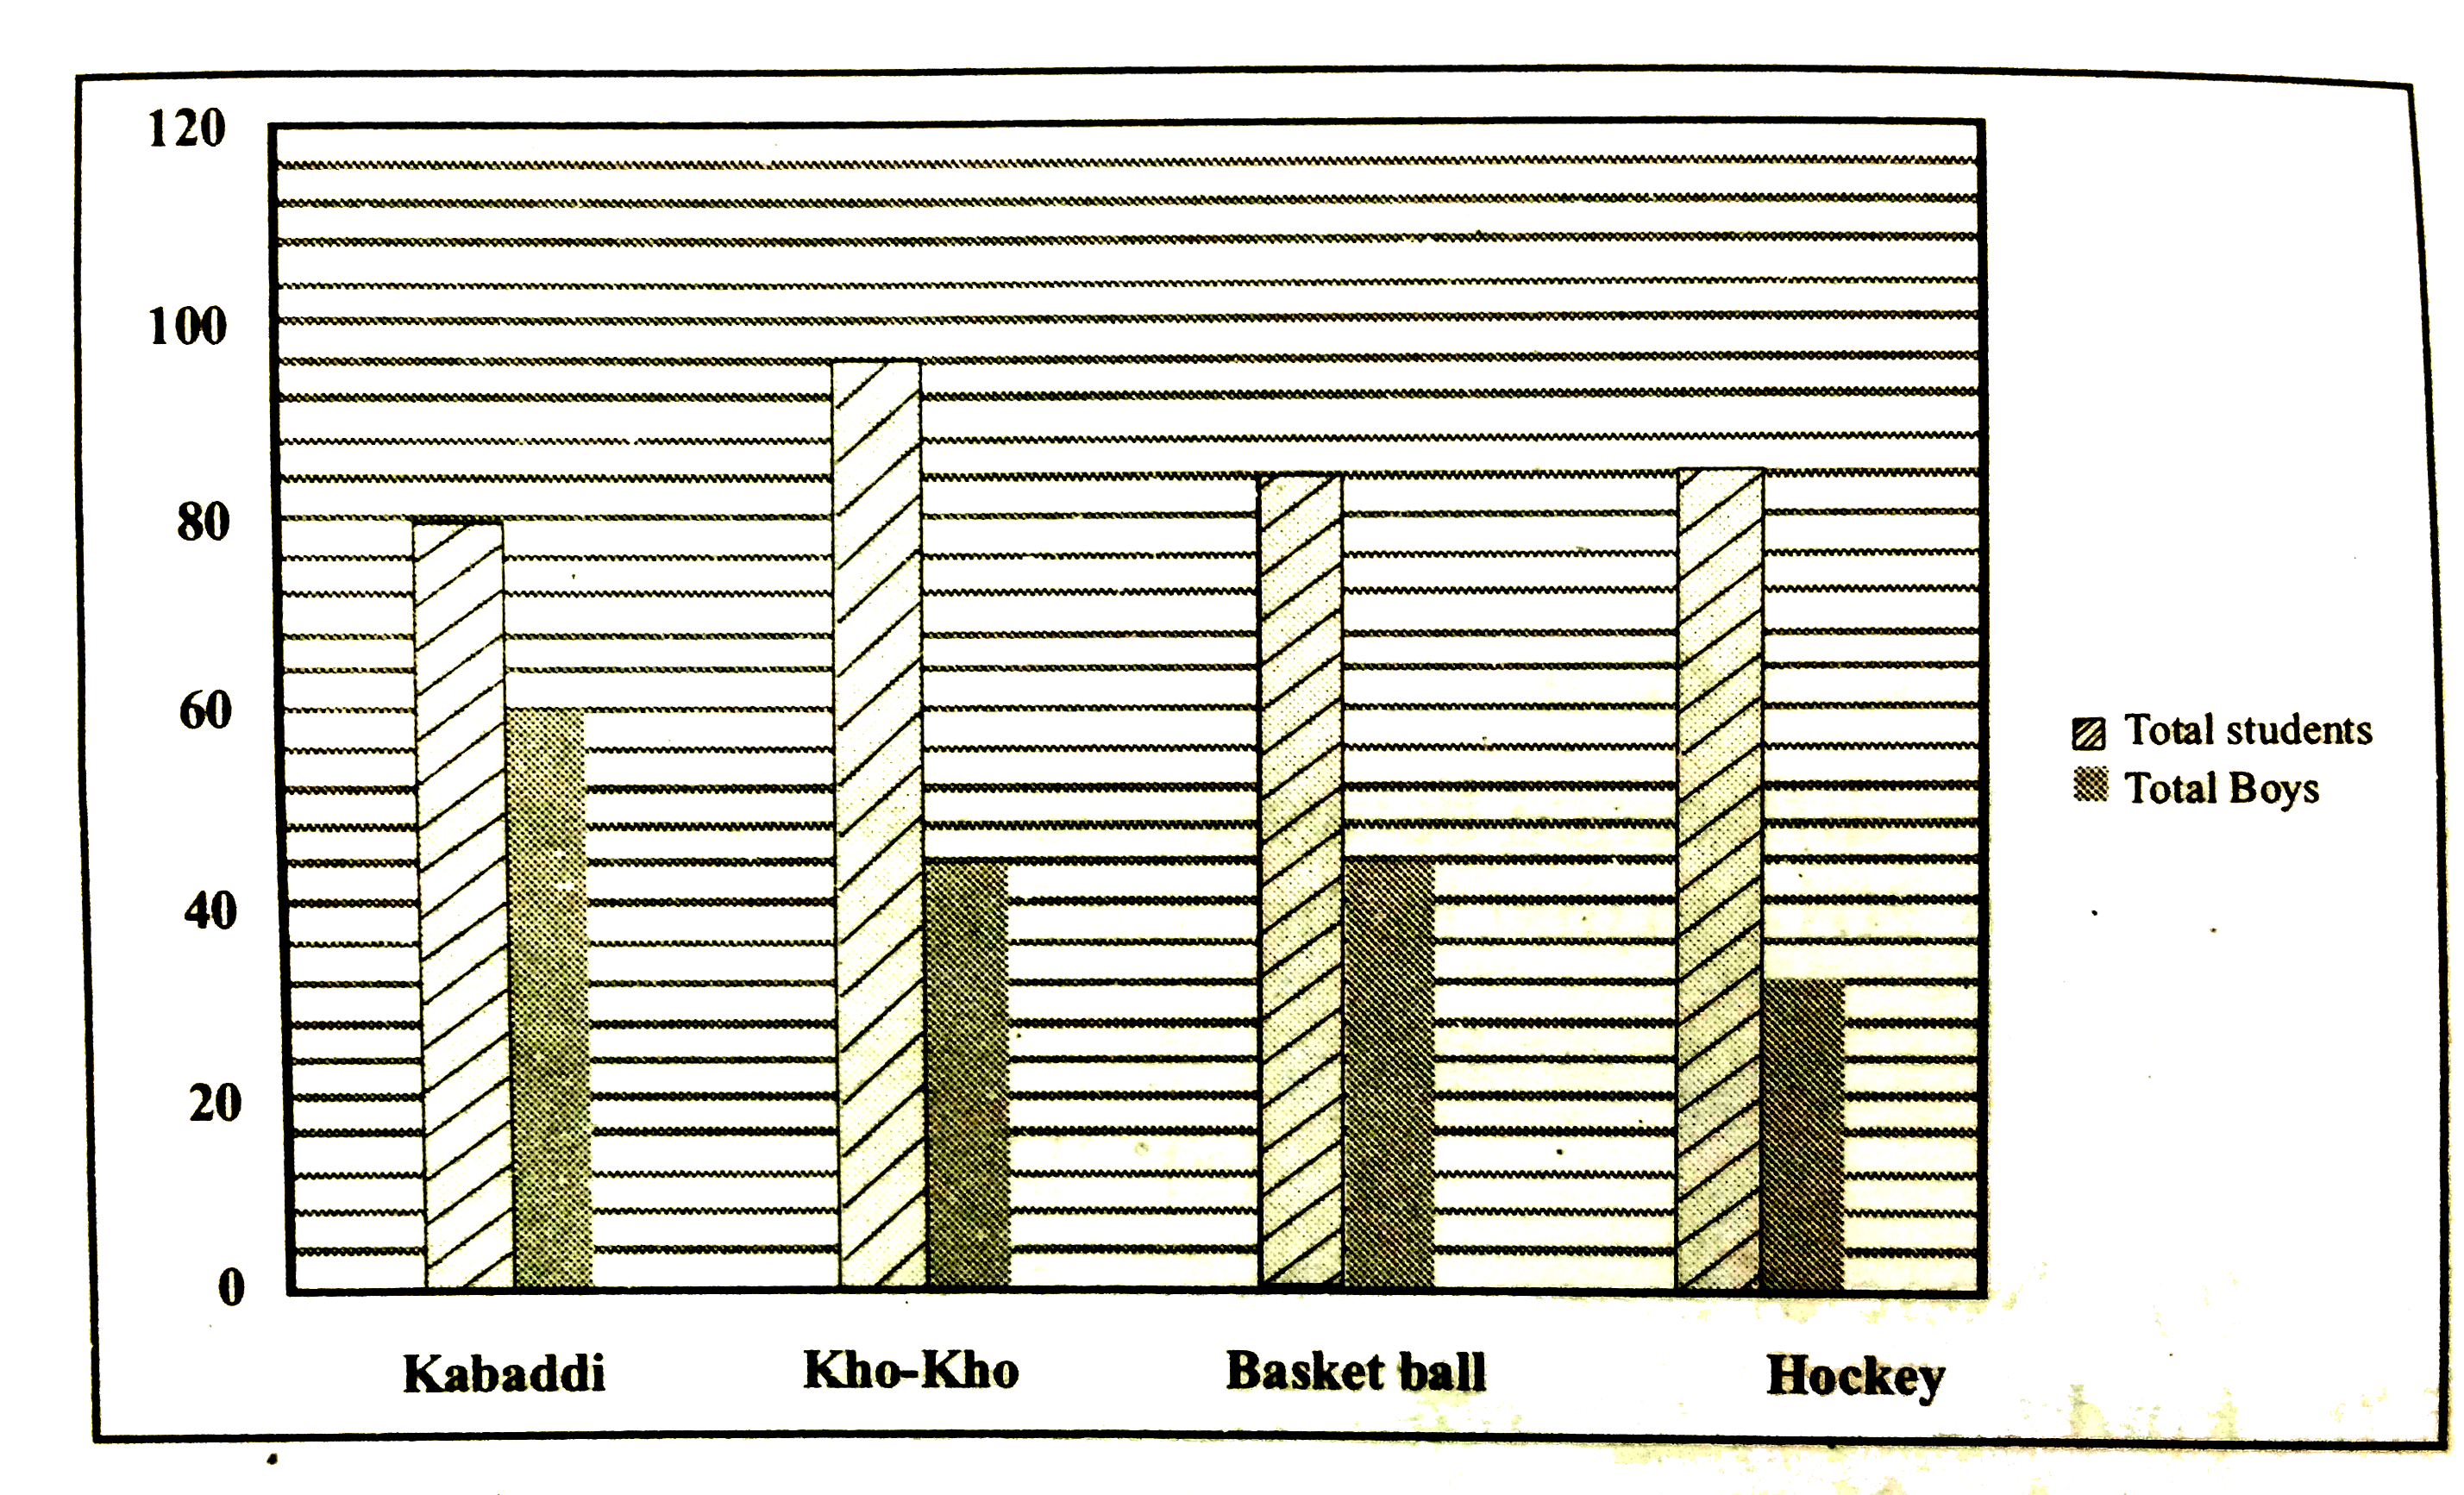
- The following bar graph shows the total number of students (Boys+Girls...
Text Solution
|
- The following bar graph shows the total number of students (Boys+Girls...
Text Solution
|
- The following bar graph shows the total number of students (Boys+Girls...
Text Solution
|
- The following bar graph shows the total number of students (Boys+Girls...
Text Solution
|
- The following bar graph shows the total number of students (Boys+Girls...
Text Solution
|
- The following pie chart 1 shows the percentage distribution of total n...
Text Solution
|
- The following pie chart 1 shows the percentage distribution of total n...
Text Solution
|
- The following pie chart 1 shows the percentage distribution of total n...
Text Solution
|
- The following pie chart 1 shows the percentage distribution of total n...
Text Solution
|
- The following pie chart 1 shows the percentage distribution of total n...
Text Solution
|
- The following table shows the number of classes taken by each Teacher ...
Text Solution
|
- The following table shows the number of classes taken by each Teacher ...
Text Solution
|
- The following table shows the number of classes taken by each Teacher ...
Text Solution
|
- The following table shows the number of classes taken by each Teacher ...
Text Solution
|
- The following table shows the number of classes taken by each Teacher ...
Text Solution
|
- In the year 2014, the salary expense of Books Publishing company is 16...
Text Solution
|
- In the year 2014, the salary expense of Books Publishing company is 16...
Text Solution
|
- In the year 2014, the salary expense of Books Publishing company is 16...
Text Solution
|
- In the year 2014, the salary expense of Books Publishing company is 16...
Text Solution
|