A
B
C
D
Text Solution
Verified by Experts
The correct Answer is:


IBPS & SBI PREVIOUS YEAR PAPER-DATA INTERPRETATION AND CASELETS-QUESTIONS
- Which of the following equation is best representation of given grap...
Text Solution
|
- Which of the following equation is best representation of following gr...
Text Solution
|
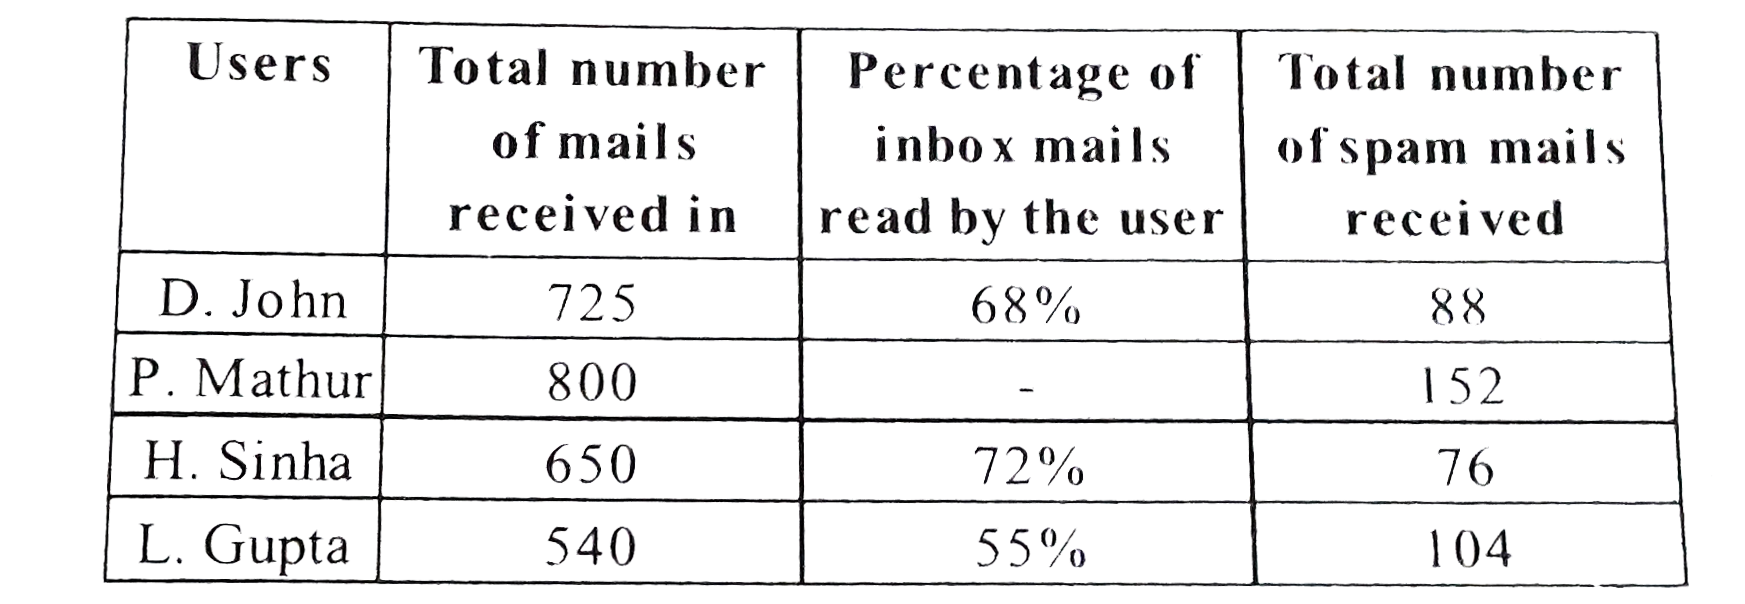
- The following table show the total number of mails received in inbox b...
Text Solution
|
- The following table show the total number of mails received in inbox b...
Text Solution
|
- The following table show the total number of mails received in inbox b...
Text Solution
|
- The following table show the total number of mails received in inbox b...
Text Solution
|
- The following table show the total number of mails received in inbox b...
Text Solution
|
- The following bar graph shows the price per square feet ( in Rs. ) of ...
Text Solution
|
- The following bar graph shows the price per square feet ( in Rs. ) of ...
Text Solution
|
- The following bar graph shows the price per square feet ( in Rs. ) of ...
Text Solution
|
- The following bar graph shows the price per square feet ( in Rs. ) of ...
Text Solution
|
- The following bar graph shows the price per square feet ( in Rs. ) of ...
Text Solution
|
- No. of query resolved by Akshay and Chitra on Saturday is 540. What co...
Text Solution
|
- Number of queries resolved by Banty on Tuesday is 270 and call recived...
Text Solution
|
- If 20% calls increases from Tuesday to Starday for Banty and Chitra an...
Text Solution
|
- What is the ratio of cells received by Akshay, Banty and Chitra on Sat...
Text Solution
|
- A shopkeeper sells one-third of his goods at a profit of 10%, another ...
Text Solution
|
- Certain number of people work in three farms. A , B and C . Three are ...
Text Solution
|
- A man bought an article and sold it at a gain of 5 %. If he had bought...
Text Solution
|
- Certain number of people work in three farms. A , B and C . Three are ...
Text Solution
|